Analysis - by Component (Hardware and Software), Enterprise Size (SMEs and Large Enterprise), Application (Serialization and Aggregation), and End Users (Pharmaceutical, Medical Devices, Consumer Goods, Food & Beverages, and Others)
No. of Pages:111
Report Code:
BMIRE00030388
Category:
Technology, Media and Telecommunications
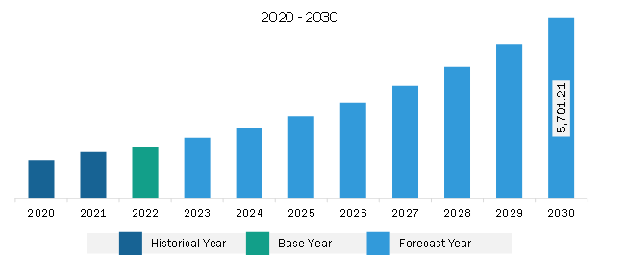
The Asia Pacific track and trace solutions market was valued at US$ 1,638.54 million in 2022 and is expected to reach US$ 5,701.21 million by 2030; it is estimated to register a CAGR of 16.9% from 2022 to 2030.
Growth in Offshore Pharmaceutical Manufacturing Boosts Asia Pacific Track and Trace Solutions Market
Offshoring contract manufacturing is for large pharma firms looking to increase productivity and efficiency in drug manufacturing. The developing nations are significantly developing their pharmaceutical facilities and services and are heading toward technological advancements. India's pharmaceutical market is continuously growing, and the country's generic drug manufacturers hold a strong position in the global supply chain.
These companies are playing a pivotal role in developing the industry in India. Pharmaceutical manufacturing companies in India are one of the world's largest sources of generic drugs, supplying 50% of global demand for a range of vaccines, 40% of the generic market in the US, and 25% of all UK medicine.
According to FDA, through its investment in biomedical research, the US has become a world leader in drug discovery and development, but it is no longer at the forefront of drug manufacturing. Historically, the production of medicines for the US population has been domestically based. However, drug manufacturing has gradually moved out of the country in recent decades. This is particularly true for manufacturers of active pharmaceutical ingredients (APIs)-the actual drugs that are then formulated into tablets, capsules, injections, etc. As of August 2019, only 28% of the manufacturing facilities made APIs to supply the US market. By contrast, 72% of the API manufacturers supplying the US market were overseas, and 13% were in China. China currently accounts for around 40% of APIs produced globally, and external markets such as Europe offer companies from China additional market potential for affordable generics and APIs. The plan here might be to adapt an existing product for sale in the EU, perhaps even relocating manufacturing operations or forming a local sales partnership with a European brand.
For many industries, China's steady rise as a global economic powerhouse has seen it transform into one of the world's foremost drivers of both production and demand. Even small economic fluctuations in China can have ripple effects that are felt across sectors worldwide. The country continues its economic transition from a heavy manufacturing focus toward a more service-based model, and its healthcare provision is being assigned an increasingly high priority.
China's healthcare market is experiencing double-digit growth. However, the relatively low healthcare spending as a portion of GDP in China (which is around 6% in China compared to a range between 10% and 17% in the US, Europe, and Japan) suggests that the market is still primed for further expansion. The Chinese healthcare is becoming more attractive for companies. The offshoring manufacturing processes is an attractive cost-saving option. Thus, the opportunities for players entering the market with cost-effective products are higher.
Asia Pacific Track and Trace Solutions Market Overview
The Asia Pacific track & trace solution market is segmented into China, Japan, India, South Korea, Australia, and the Rest of Asia Pacific. China held the largest share of the market in 2022, and India is expected to exhibit a significant growth pace in the market. The market growth in these countries is attributed to the favorable policies intended for track & trace solution for pharmaceuticals, food & beverages, and consumer goods. Moreover, expansion and product launch strategies implemented by market players contribute to the growth of the track & trace solution market in the region.
In many industries, track and trace solutions solve quality management problems related to manufacturing, product quality, and customer satisfaction.
For example, China had mandates related to a complex set of product master data, company master data, and production/distribution and operational data that must be captured, organized, and reported. Per The Chinese Department of General Administration of Quality Supervision, electronic monitoring of medical product quality must be done through special provisions, particularly by strengthening food safety supervision and management by the State Council.
Asia Pacific Track and Trace Solutions Market Revenue and Forecast to 2030 (US$ Million)
Asia Pacific Track and Trace Solutions Market Segmentation
Based on component, the Asia Pacific track and trace solutions market is bifurcated into hardware and software. The software segment held a larger Asia Pacific track and trace solutions market share in 2022. Furthermore, the software segment is subcategorized into plant manager, line controller, and others. Additionally, the hardware segment is subsegmented into barcode scanner, radiofrequency identification (RFID) reader, and others.
In terms of enterprise size, the Asia Pacific track and trace solutions market is segmented into SMEs and large enterprise. The large enterprise segment held a larger Asia Pacific track and trace solutions market share in 2022.
By application, the Asia Pacific track and trace solutions market is divided into serialization solutions and aggregation solutions. The serialization solutions segment held a larger Asia Pacific track and trace solutions market share in 2022.
In terms of end users, the Asia Pacific track and trace solutions market is categorized into pharmaceutical, medical devices, consumer goods, food & beverages, and others. The pharmaceutical segment held the largest Asia Pacific track and trace solutions market share in 2022.
Based on country, the Asia Pacific track and trace solutions market is categorized into China, Japan, India, South Korea, Australia, and the Rest of Asia Pacific. China dominated the Asia Pacific track and trace solutions market share in 2022.
SAP SE, Uhlmann Pac-Systeme GmbH & Co KG, WIPOTEC GmbH, Bar Code India Ltd, Korber AG, Videojet Technologies Inc, Domino Printing Sciences plc, Kezzler AS, rfxcel Corp, NeuroTags Inc, and Jekson Vison Pvt Ltd. are some of the leading companies operating in the Asia Pacific track and trace solutions market.
Asia Pacific Track and Trace Solutions Market Strategic Insights
Get more information on this report
Asia Pacific Track and Trace Solutions Market Segmentation Analysis
Asia Pacific Track and Trace Solutions Market Report Highlights
Asia Pacific Track and Trace Solutions Report Scope
Report Attribute
Details
Market size in 2022
US$ 1,638.54 Million
Market Size by 2030
US$ 5,701.21 Million
CAGR (2022 - 2030)
16.9%
Historical Data
2020-2021
Forecast period
2023-2030
Segments Covered
By Component
Hardware
Software
By Enterprise Size
SMEs and Large Enterprise
By End Users
Pharmaceutical
Medical Devices
Consumer Goods
Food & Beverages
Regions and Countries Covered
Asia-Pacific
China, India, Japan, Australia, Rest of Asia-Pacific
Market leaders and key company profiles
SAP SE
Uhlmann Pac-Systeme GmbH & Co KG
WIPOTEC GmbH
Bar Code India Ltd
Korber AG
Videojet Technologies Inc
Domino Printing Sciences plc
Kezzler AS
rfxcel Corp
NeuroTags Inc
Jekson Vison Pvt Ltd
Get more information on this report
Asia Pacific Track and Trace Solutions Market Country and Regional Insights
Get more information on this report
Identical Market Reports with other Region/Countries
The List of Companies - Asia Pacific Track and Trace Solutions Market
1. SAP SE 2. Uhlmann Pac-Systeme GmbH & Co KG 3. WIPOTEC GmbH 4. Bar Code India Ltd 5. Korber AG 6. Videojet Technologies Inc 7. Domino Printing Sciences plc 8. Kezzler AS 9. rfxcel Corp 10. NeuroTags Inc 11. Jekson Vison Pvt Ltd
Frequently Asked Questions
How big is the Asia Pacific Track and Trace Solutions Market?
The Asia Pacific Track and Trace Solutions Market is valued at US$ 1,638.54 Million in 2022, it is projected to reach US$ 5,701.21 Million by 2030.
What is the CAGR for Asia Pacific Track and Trace Solutions Market by (2022 - 2030)?
As per our report Asia Pacific Track and Trace Solutions Market, the market size is valued at US$ 1,638.54 Million in 2022, projecting it to reach US$ 5,701.21 Million by 2030. This translates to a CAGR of approximately 16.9% during the forecast period.
What segments are covered in this report?
The Asia Pacific Track and Trace Solutions Market report typically cover these key segments-
Component (Hardware, Software)
Enterprise Size (SMEs and Large Enterprise)
End Users (Pharmaceutical, Medical Devices, Consumer Goods, Food & Beverages)
What is the historic period, base year, and forecast period taken for Asia Pacific Track and Trace Solutions Market?
The historic period, base year, and forecast period can vary slightly depending on the specific market research report. However, for the Asia Pacific Track and Trace Solutions Market report:
Historic Period : 2020-2021
Base Year : 2022
Forecast Period : 2023-2030
Who are the major players in Asia Pacific Track and Trace Solutions Market?
The Asia Pacific Track and Trace Solutions Market is populated by several key players, each contributing to its growth and innovation. Some of the major players include:
SAP SE
Uhlmann Pac-Systeme GmbH & Co KG
WIPOTEC GmbH
Bar Code India Ltd
Korber AG
Videojet Technologies Inc
Domino Printing Sciences plc
Kezzler AS
rfxcel Corp
NeuroTags Inc
Jekson Vison Pvt Ltd
Who should buy this report?
The Asia Pacific Track and Trace Solutions Market report is valuable for diverse stakeholders, including:
Investors: Provides insights for investment decisions pertaining to market growth, companies, or industry insights. Helps assess market attractiveness and potential returns.
Industry Players: Offers competitive intelligence, market sizing, and trend analysis to inform strategic planning, product development, and sales strategies.
Suppliers and Manufacturers: Helps understand market demand for components, materials, and services related to concerned industry.
Researchers and Consultants: Provides data and analysis for academic research, consulting projects, and market studies.
Financial Institutions: Helps assess risks and opportunities associated with financing or investing in the concerned market.
Essentially, anyone involved in or considering involvement in the Asia Pacific Track and Trace Solutions Market value chain can benefit from the information contained in a comprehensive market report.


 Get Free Sample For Asia Pacific Track and Trace Solutions Market


