Analysis - by Chemical Type (Lignin Sulfonate, Calcium Chloride, Magnesium Chloride, Asphalt Emulsions, Oil Emulsions, Polymeric Emulsions, and Others) and End-Use Industry (Mining, Construction, Oil and Gas, Food and Beverage, Textile, Glass and Ceramics, Pharmaceuticals, and Others)
No. of Pages:106
Report Code:
BMIRE00030249
Category:
Chemicals and Materials
Asia Pacific Dust Control or Suppression Chemicals Market
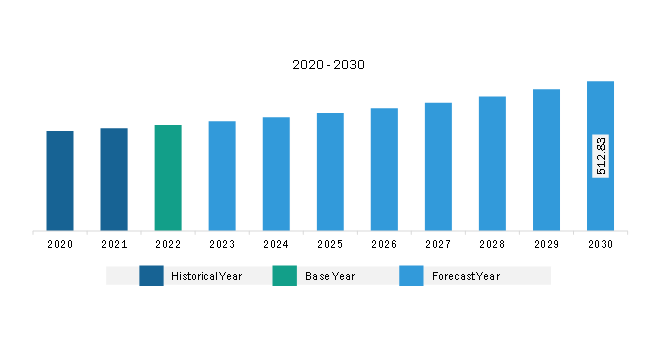
The Asia Pacific dust control or suppression chemicals market was valued at US$ 363.31 million in 2022 and is expected to reach US$ 512.83 million by 2030; it is estimated to record a CAGR of 4.4% from 2022 to 2030.
Strong Growth in Pharmaceutical and Food Processing Industry Boosts Asia Pacific Dust Control or Suppression Chemicals Market
The pharmaceutical market in Asia Pacific is the second largest globally, following that of North America. It is anticipated that the Asia Pacific market will surpass Western Europe, which is presently ranked third, by 2021. Numerous factors are responsible for this, including the size of the population, particularly the geriatric population, GDP per capita, health care costs, regulatory frameworks, attitudes of physicians, and the prevalence of disease. For instance, as per Invest India, it is anticipated that India's pharmaceutical market will grow to US$ 65 billion and US$ 130 billion by 2024 and 2030, respectively. The development of the pharmaceutical industry boosts innovation and creates a conducive environment for conducting clinical research in the country. Pharmaceutical processes such as active pharmaceutical ingredients production, tablet presses, tablet coating, spray drying, and granulation lead to dust formation.
Currently, the amount of processed food varies from nation to nation in the Asia-Pacific region. Japan continues to have the biggest food processing market in Asia, but due to market saturation, it is predicted to grow more slowly in the future than China and India. The food processing sectors in China and India are anticipated to be driven by rising per capita income, an expanding working class, and the growing popularity of ready-to-eat food. Trade liberalization brought about by international and regional trade agreements is fostering growth in the Asia-Pacific food processing sector and will provide industry participants with increased access to markets. For instance, the FDI in India's food processing sector was US$ 709.72 million during April 2021-March 2022. Also, Thailand now possesses one of the most advanced food processing industries in all of Southeast Asia, owing to its rapid development. Many medium-sized and larger food processors create higher-quality goods for both local and international markets. In 2020, Thai exports of processed foods were valued at US$ 19.4 billion. Dust control or suppression is a significant aspect of food processing from both food safety and employee health perspective. The presence of dust in the processing environment can cause sanitation concerns, microbial contamination, health issues, and other hazards. Food processors also adhere to regulations for controlling food processing dust by several government and international authorities. Thus, strong presence of food processing industry is projected to create lucrative opportunities for the dust control or suppression chemicals market.
Asia Pacific Dust Control or Suppression Chemicals Market Overview
Asia Pacific is witnessing urbanization and the rising construction of commercial and residential projects. Additionally, the per capita income in the region has been increasing, coupled with the development of affordable residential buildings. The increasing expansion of foreign companies in Asia Pacific has created a demand for new offices, production houses, and buildings, thereby driving the construction sector in the region. Thus, the growing construction industry in the region boosts the demand for dust suppressant chemicals.
Asia Pacific dominated the market worldwide, with the largest consumption coming from China and India. The Government of India launched an infrastructure project to build 66,100 km of economic corridors, expressways, and border & coastal roads to boost the highway network. Similarly, according to the International Trade Administration, from 2019 to 2021, China's construction industry revenue is expected to increase from US$ 968 billion to US$ 1.1 trillion. China's urbanization rate is among the highest in the world. Thus, with the huge investment in roads and highway construction in India and the growing construction industry in China, the dust suppressant chemicals market is estimated to grow considerably during the forecast period.
Asia Pacific Dust Control or Suppression Chemicals Market Revenue and Forecast to 2030 (US$ Million)
Asia Pacific Dust Control or Suppression Chemicals Market Segmentation
The Asia Pacific dust control or suppression chemicals market is segmented based on chemical type, end-use industry, and country. Based on chemical type, the Asia Pacific dust control or suppression chemicals market is segmented into lignin sulfonate, calcium chloride, magnesium chloride, asphalt emulsions, oil emulsions, polymeric emulsions, and others. The calcium chloride segment held the largest market share in 2022.
In terms of end-use industry, the Asia Pacific dust control or suppression chemicals market is categorized into mining, construction, oil and gas, food and beverage, textile, glass and ceramics, pharmaceuticals, and others. The mining segment held the largest market share in 2022.
Based on country, the Asia Pacific dust control or suppression chemicals market is segmented into Australia, China, India, Japan, South Korea, and the Rest of Asia Pacific. China dominated the Asia Pacific dust control or suppression chemicals market share in 2022.
Benetech Inc, Veolia Environnement SA, Ecolab Inc, Quaker Chemical Corp, Dow Inc, BASF SE, Solenis LLC, and Borregaard ASA are some of the leading players operating in the Asia Pacific dust control or suppression chemicals market.
Asia Pacific Dust Control or Suppression Chemicals Market Strategic Insights
Get more information on this report
Asia Pacific Dust Control or Suppression Chemicals Market Segmentation Analysis
Asia Pacific Dust Control or Suppression Chemicals Market Report Highlights
Asia Pacific Dust Control or Suppression Chemicals Report Scope
Report Attribute
Details
Market size in 2022
US$ 363.31 Million
Market Size by 2030
US$ 512.83 Million
CAGR (2022 - 2030)
4.4%
Historical Data
2020-2021
Forecast period
2023-2030
Segments Covered
By Chemical Type
Lignin Sulfonate
Calcium Chloride
Magnesium Chloride
Asphalt Emulsions
Oil Emulsions
Polymeric Emulsions
By End-Use Industry
Mining
Construction
Oil and Gas
Food and Beverage
Textile
Glass and Ceramics
Pharmaceuticals
Regions and Countries Covered
Asia-Pacific
China, India, Japan, Australia, Rest of Asia-Pacific
Market leaders and key company profiles
Benetech Inc
Veolia Environnement SA
Ecolab Inc
Quaker Chemical Corp
Dow Inc
BASF SE
Solenis LLC
Borregaard ASA
Get more information on this report
Asia Pacific Dust Control or Suppression Chemicals Market Country and Regional Insights
Get more information on this report
Identical Market Reports with other Region/Countries
The List of Companies - Asia Pacific Dust Control or Suppression Chemicals Market
1. Benetech Inc2. Veolia Environnement SA3. Ecolab Inc4. Quaker Chemical Corp5. Dow Inc6. BASF SE7. Solenis LLC8. Borregaard ASA
Frequently Asked Questions
How big is the Asia Pacific Dust Control or Suppression Chemicals Market?
The Asia Pacific Dust Control or Suppression Chemicals Market is valued at US$ 363.31 Million in 2022, it is projected to reach US$ 512.83 Million by 2030.
What is the CAGR for Asia Pacific Dust Control or Suppression Chemicals Market by (2022 - 2030)?
As per our report Asia Pacific Dust Control or Suppression Chemicals Market, the market size is valued at US$ 363.31 Million in 2022, projecting it to reach US$ 512.83 Million by 2030. This translates to a CAGR of approximately 4.4% during the forecast period.
What segments are covered in this report?
The Asia Pacific Dust Control or Suppression Chemicals Market report typically cover these key segments-
Chemical Type (Lignin Sulfonate, Calcium Chloride, Magnesium Chloride, Asphalt Emulsions, Oil Emulsions, Polymeric Emulsions)
End-Use Industry (Mining, Construction, Oil and Gas, Food and Beverage, Textile, Glass and Ceramics, Pharmaceuticals)
What is the historic period, base year, and forecast period taken for Asia Pacific Dust Control or Suppression Chemicals Market?
The historic period, base year, and forecast period can vary slightly depending on the specific market research report. However, for the Asia Pacific Dust Control or Suppression Chemicals Market report:
Historic Period : 2020-2021
Base Year : 2022
Forecast Period : 2023-2030
Who are the major players in Asia Pacific Dust Control or Suppression Chemicals Market?
The Asia Pacific Dust Control or Suppression Chemicals Market is populated by several key players, each contributing to its growth and innovation. Some of the major players include:
Benetech Inc
Veolia Environnement SA
Ecolab Inc
Quaker Chemical Corp
Dow Inc
BASF SE
Solenis LLC
Borregaard ASA
Who should buy this report?
The Asia Pacific Dust Control or Suppression Chemicals Market report is valuable for diverse stakeholders, including:
Investors: Provides insights for investment decisions pertaining to market growth, companies, or industry insights. Helps assess market attractiveness and potential returns.
Industry Players: Offers competitive intelligence, market sizing, and trend analysis to inform strategic planning, product development, and sales strategies.
Suppliers and Manufacturers: Helps understand market demand for components, materials, and services related to concerned industry.
Researchers and Consultants: Provides data and analysis for academic research, consulting projects, and market studies.
Financial Institutions: Helps assess risks and opportunities associated with financing or investing in the concerned market.
Essentially, anyone involved in or considering involvement in the Asia Pacific Dust Control or Suppression Chemicals Market value chain can benefit from the information contained in a comprehensive market report.


 Get Free Sample For Asia Pacific Dust Control or Suppression Chemicals Market


