Previsioni di mercato di Revenue Assurance per l\'Africa fino al 2030 - Analisi regionale - per componente (soluzioni e servizi), implementazione (on-premise e basata su cloud), dimensione dell\'organizzazione (PMI e grandi imprese) e verticale (BFSI, ospitalità, telecomunicazioni, servizi di pubblica utilità, e altri)
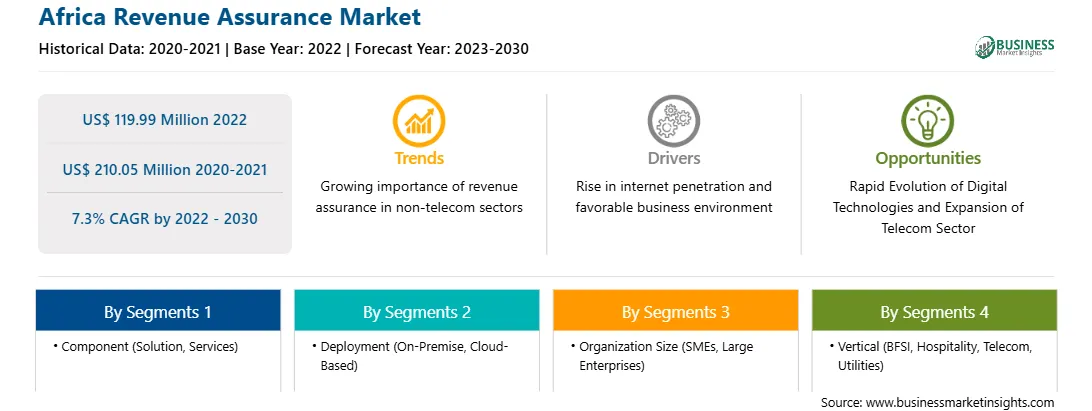
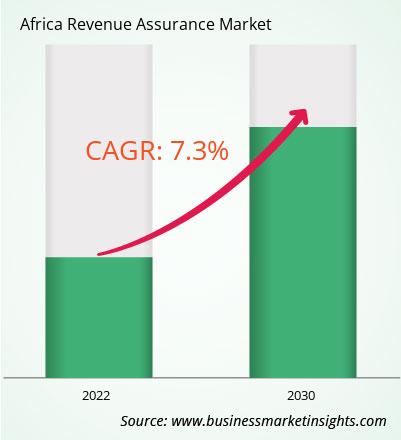
Il mercato africano delle assicurazioni sulle entrate è stato valutato a 119,99 milioni di dollari nel 2022 e si prevede che raggiungerà i 210,05 milioni di dollari entro il 2030; si stima che registrerà un CAGR del 7,3% dal 2022 al 2030.
L\'aumento della penetrazione di Internet alimenta il mercato della Revenue Assurance in Africa.
Mentre l\'utilizzo di Internet continua a crescere, sempre più aziende conducono le proprie operazioni online , portando ad un aumento della generazione di transazioni digitali e dei flussi di entrate. Secondo i dati della Banca Mondiale, a livello globale, il numero di individui che utilizzano Internet nel 2021 è stato del 63%, in aumento rispetto al 60% del 2020. Con più persone che accedono a Internet, si verificano più transazioni digitali. Ciò include acquisti online, pagamenti digitali e altre attività finanziarie online. Maggiore è il volume delle transazioni, maggiore è la necessità di misure efficaci di assicurazione delle entrate per garantire una fatturazione accurata, prevenire perdite di entrate e individuare attività fraudolente. Inoltre, l’aumento della penetrazione di Internet ha alimentato la crescita del settore dell’e-commerce. Le piattaforme e i mercati di vendita al dettaglio online stanno registrando un aumento dell’attività, con un numero maggiore di aziende e consumatori che partecipano agli acquisti e alle vendite online. La garanzia delle entrate è fondamentale per garantire un accurato riconoscimento delle entrate, gestire l\'inventario e prevenire perdite di entrate nel commercio elettronico. Si registra un aumento significativo nell’uso di Internet mobile. Poiché sempre più persone accedono a Internet tramite i propri dispositivi mobili, vi è la necessità di soluzioni di assicurazione dei ricavi in grado di monitorare e gestire in modo efficace i flussi di entrate provenienti dai servizi mobili, come dati mobili, chiamate vocali e servizi a valore aggiunto. Pertanto, la crescente penetrazione di Internet rappresenta un fattore trainante significativo per il mercato della garanzia dei ricavi.
Panoramica del mercato della Revenue Assurance in Africa
L\'impennata della tecnologia mobile è uno dei principali fattori che promuovono la crescita del settore della Revenue Assurance in Africa. La tecnologia mobile è destinata a svolgere un ruolo cruciale nel modo in cui le persone vivono e operano le imprese, consentendo nuove soluzioni digitali sia per le grandi che per le piccole imprese e migliorando il supporto disponibile per i consumatori attraverso canali online ampliati. L\'adozione della tecnologia 4G è cresciuta in modo significativo negli ultimi anni, principalmente a causa della crescente domanda di velocità più elevate, in particolare tra i consumatori più giovani. Nei prossimi cinque anni, si prevede che l’adozione del 4G nell’Africa sub-sahariana raddoppierà, raggiungendo un tasso di penetrazione del 45%. Anche lo slancio per la diffusione del 5G sta guadagnando terreno, con un focus iniziale sulle aree urbane e sui siti industriali con una maggiore domanda di connettività avanzata. Si prevede che l’introduzione del 5G contribuirà con 11 miliardi di dollari all’economia dell’Africa sub-sahariana entro il 2030, pari a oltre il 6% dell’impatto economico complessivo del settore della telefonia mobile.
Entrate e previsioni del mercato Africa Revenue Assurance fino al 2030 (milioni di dollari)
Segmentazione del mercato Africa Revenue Assurance
Il mercato Africa Revenue Assurance è classificato in componenti, distribuzione, organizzazione dimensione, verticale e paese.
In base ai componenti, il mercato dell\'assicurazione delle entrate in Africa è biforcato in soluzioni e servizi. Il segmento delle soluzioni ha detenuto una quota di mercato maggiore nel 2022.
In base alla distribuzione, il mercato della garanzia dei ricavi in Africa è biforcato in locale e basato sul cloud. Il segmento basato sul cloud deteneva una quota di mercato maggiore nel 2022.
In base alle dimensioni dell\'organizzazione, il mercato della assicurazione dei ricavi in Africa è biforcato in PMI e grandi imprese. Il segmento delle grandi imprese deteneva una quota di mercato maggiore nel 2022.
In base alla verticale, il mercato della assicurazione dei ricavi in Africa è classificato in BFSI, ospitalità, telecomunicazioni, servizi di pubblica utilità e altri. Il segmento delle telecomunicazioni ha detenuto la quota di mercato maggiore nel 2022.
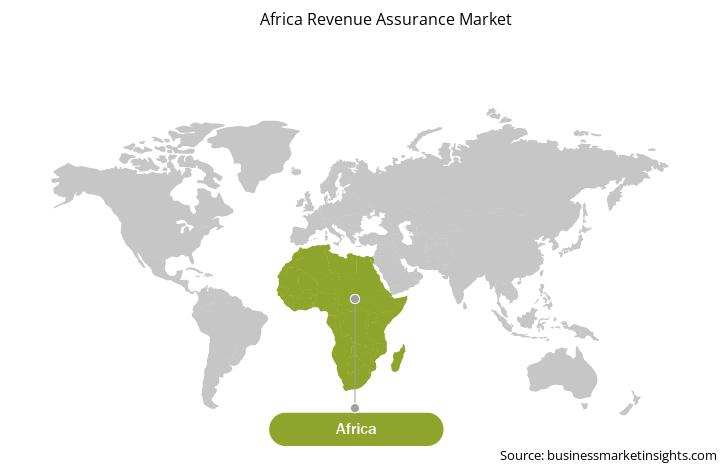
Per paese, il mercato della assicurazione dei ricavi in Africa è segmentato in Africa settentrionale, Africa occidentale, Africa meridionale, Africa orientale e Africa centrale. Il Nord Africa ha dominato la quota di mercato del Revenue Insurance in Africa nel 2022.
Nokia Corp, Tata Consultancy Services Ltd, Amdocs, BDO South Africa Inc, Araxxe SAS, Panamax Inc e Adapt IT Holding Proprietary Ltd sono alcuni dei leader società che operano nel mercato africano delle assicurazioni sulle entrate.
Africa Revenue Assurance Strategic Insights
Strategic insights for Africa Revenue Assurance involve closely monitoring industry trends, consumer behaviours, and competitor actions to identify opportunities for growth. By leveraging data analytics, businesses can anticipate market shifts and make informed decisions that align with evolving customer needs. Understanding these dynamics helps companies adjust their strategies proactively, enhance customer engagement, and strengthen their competitive edge. Building strong relationships with stakeholders and staying agile in response to changes ensures long-term success in any market.
Get more information on this report
Africa Revenue Assurance Report Scope
Report Attribute
Details
Market size in 2022
US$ 119.99 Million
Market Size by 2030
US$ 210.05 Million
Global CAGR (2022 - 2030)
7.3%
Historical Data
2020-2021
Forecast period
2023-2030
Segments Covered
By Componente
Soluzione
Servizi
By Distribuzione
on-premise
basata su cloud
By Dimensioni dell\'organizzazione
PMI
grandi imprese
By Verticale
BFSI
OspitalitÃ
Telecomunicazioni
Servizi di pubblica utilitÃ
Regions and Countries Covered
Africa
Africa
Market leaders and key company profiles
Nokia Corp
Tata Consultancy Services Ltd
Amdocs
Araxxe SAS
BDO South Africa Inc
Panamax Inc
Adapt IT Holdings Proprietary Ltd
Get more information on this report
Africa Revenue Assurance Regional Insights
The regional scope of Africa Revenue Assurance refers to the geographical area in which a business operates and competes. Understanding regional nuances, such as local consumer preferences, economic conditions, and regulatory environments, is crucial for tailoring strategies to specific markets. Businesses can expand their reach by identifying underserved regions or adapting their offerings to meet regional demands. A clear regional focus allows for more effective resource allocation, targeted marketing, and better positioning against local competitors, ultimately driving growth in those specific areas.
Get more information on this report
Identical Market Reports with other Region/Countries
The List of Companies - Africa Revenue Assurance Market
1. Nokia Corp 2. Tata Consultancy Services Ltd 3. Amdocs 4. Araxxe SAS 5. BDO South Africa Inc 6. Panamax Inc 7. Adapt IT Holdings Proprietary Ltd
Frequently Asked Questions
How big is the Africa Revenue Assurance Market?
The Africa Revenue Assurance Market is valued at US$ 119.99 Million in 2022, it is projected to reach US$ 210.05 Million by 2030.
What is the CAGR for Africa Revenue Assurance Market by (2022 - 2030)?
As per our report Africa Revenue Assurance Market, the market size is valued at US$ 119.99 Million in 2022, projecting it to reach US$ 210.05 Million by 2030. This translates to a CAGR of approximately 7.3% during the forecast period.
What segments are covered in this report?
The Africa Revenue Assurance Market report typically cover these key segments-
Componente (Soluzione, Servizi)
Distribuzione (on-premise, basata su cloud)
Dimensioni dell\'organizzazione (PMI, grandi imprese)
What is the historic period, base year, and forecast period taken for Africa Revenue Assurance Market?
The historic period, base year, and forecast period can vary slightly depending on the specific market research report. However, for the Africa Revenue Assurance Market report:
Historic Period : 2020-2021
Base Year : 2022
Forecast Period : 2023-2030
Who are the major players in Africa Revenue Assurance Market?
The Africa Revenue Assurance Market is populated by several key players, each contributing to its growth and innovation. Some of the major players include:
Nokia Corp
Tata Consultancy Services Ltd
Amdocs
Araxxe SAS
BDO South Africa Inc
Panamax Inc
Adapt IT Holdings Proprietary Ltd
Who should buy this report?
The Africa Revenue Assurance Market report is valuable for diverse stakeholders, including:
Investors: Provides insights for investment decisions pertaining to market growth, companies, or industry insights. Helps assess market attractiveness and potential returns.
Industry Players: Offers competitive intelligence, market sizing, and trend analysis to inform strategic planning, product development, and sales strategies.
Suppliers and Manufacturers: Helps understand market demand for components, materials, and services related to concerned industry.
Researchers and Consultants: Provides data and analysis for academic research, consulting projects, and market studies.
Financial Institutions: Helps assess risks and opportunities associated with financing or investing in the concerned market.
Essentially, anyone involved in or considering involvement in the Africa Revenue Assurance Market value chain can benefit from the information contained in a comprehensive market report.
Get Free Sample For Africa Revenue Assurance Market
1. Complete the form
2. Check your inbox (and spam/junk folder)
3. Your Personal Data is Secure with us
GDPR + CCPA Compliant
Personal & transactional information is kept safe from unauthorized use.
WHAT'S INCLUDED IN FULL REPORT : Market Dynamics,
Competitive Analysis and Assessment, Define Business Strategies, Market Outlook and
Trends, Market Size and Share Analysis, Growth Driving Factors, Future Commercial
Potential, Identify Regional Growth Engines


 Get Free Sample For Africa Revenue Assurance Market

