Analysis - by Scale (Lab-Scale Production, Pilot-Scale Production, and Full-Scale Production), Application (Microbial Application, Cell Culture Application, and Others), Technology (Fed-Batch Bioreactors and Perfusion Bioreactors), and End User (Biopharma Manufacturers, Research and Development Organizations, and Contract Manufacturing Organization)
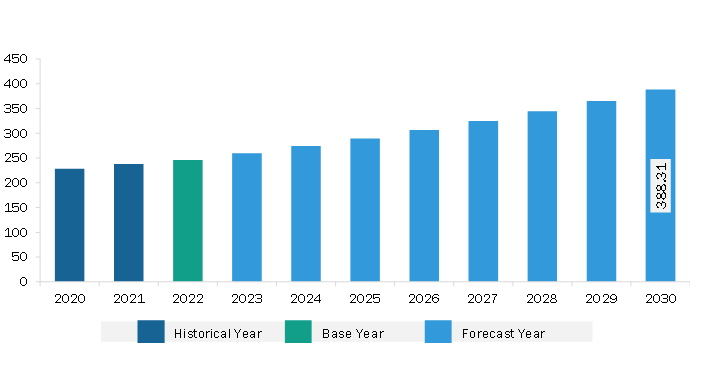
The South & Central America bioreactors market was valued at US$ 246.23 million in 2022 and is expected to reach US$ 388.31 million by 2030; it is estimated to grow at a CAGR of 5.9% from 2022 to 2030.
Rapid Growth of Pharmaceutical and Biotechnology Industry Fuels South & Central America Bioreactors Market
In recent years, the pharmaceutical industry has been growing at an unprecedented pace. Big pharmaceutical companies and contract research organizations (CROs) are coming up with new medicines and therapy forms to treat a wide range of indications. The biopharmaceuticals market is increasing. The strong demand for biologics and biosimilars has driven the growth of the industry. The biopharmaceutical industry is one of the most significant contributors to the economy. With 105 events approved, Brazil is the world's second-largest producer of biotech crops. According to FAS Brasilia, 68 million hectares will be planted with GE traits during the 2022–2023 agricultural season. Besides growing economies, rapid growth is witnessed in the research environment in emerging economies such as Brazil, China, and India. Factors such as increasing biologics approval, growing biosimilar pipeline, and rising investment in research activities are facilitating the growth of the industry.
Biopharmaceutical research activities are gaining pace in emerging economies such as Brazil, China, and India and offering lucrative opportunities to the market. Apart from this, increasing approvals in gene and cell therapies are favoring market growth. The approved gene therapies are Glybera-used to treat Lipoprotein Lipase Deficiency and Strimvelis- treating ADA-Severe Combined Immuno Deficiency. Thus, the factors mentioned above are increasing the demand for the large-scale production of various therapeutics, thereby facilitating the growth of the bioreactors market globally.
South & Central America Bioreactors Market Overview
Brazil has manufacturing plants for a large number of pharmaceutical companies. In addition, many foreign companies often collaborate and partner with Brazilian laboratories and local companies for the development of biotechnology-based medicines. The collaborative efforts are expected to yield the development of novel products in Brazil during the forecast year.
The majority of research is conducted in universities and other federal state institutions in Brazil. As per the DWIH São Paulo, biotechnology research is one of the first-tier priorities in Brazil. Many studies are being carried out in research centers in Brazil to develop advanced bioreactors for their various applications in the biotechnology sector. For instance, in an article published by MDPI in August 2022, a study was conducted by research departments of universities in Brazil. The study presented a mathematical model that was developed to describe and analyze the bioreactor's dynamic behavior during fermentation, taking into account temperature control via refrigerant fluid flow through the reactor jacket.
Similarly, another study, "Development of a Novel Pilot-Scale Tray Bioreactor for Solid-State Fermentation Aiming at Process Intensification," was carried out by researchers in Brazilian universities in November 2023. These research and development activities are anticipated to boost the bioreactor market in Brazil.
South & Central America Bioreactors Market Revenue and Forecast to 2030 (US$ Million)
South & Central America Bioreactors Market Segmentation
The South & Central America bioreactors market is segmented based on scale, application, technology, end user, and country. Based on scale, the South & Central America bioreactors market is segmented into lab-scale production, pilot-scale production, and full-scale production. The pilot-scale production segment held the largest market share in 2022.
In terms of application, the South & Central America bioreactors market is segmented into microbial application, cell culture application, and others. The cell culture application segment held the largest market share in 2022.
By technology, the South & Central America bioreactors market is bifurcated into fed-batch bioreactors and perfusion bioreactors. The fed-batch bioreactors segment held a larger market share in 2022.
Based on end user, the South & Central America bioreactors market is categorized into biopharma manufacturers, research and development organizations, and contract manufacturing organization. The research and development organizations segment held the largest market share in 2022.
Based on country, the South & Central America bioreactors market is segmented into Brazil, Argentina, and the Rest of South & Central America. Brazil dominated the South & Central America bioreactors market share in 2022.
General Electric Co, Merck KGaA, Pall Corp, PBS Biotech Inc, Sartorius AG, Solaris Biotechnology SRL, and Thermo Fisher Scientific Inc are some of the leading players operating in the South & Central America bioreactors market.
South & Central America Bioreactors Market Strategic Insights
Get more information on this report
South & Central America Bioreactors Market Segmentation Analysis
South & Central America Bioreactors Market Report Highlights
South & Central America Bioreactors Report Scope
Report Attribute
Details
Market size in 2022
US$ 246.23 Million
Market Size by 2030
US$ 388.31 Million
CAGR (2022 - 2030)
5.9%
Historical Data
2020-2021
Forecast period
2023-2030
Segments Covered
By Scale
Lab-Scale Production
Pilot-Scale Production
Full-Scale Production
By Application
Microbial Application
Cell Culture Application
By Technology
Fed-Batch Bioreactors
Perfusion Bioreactors
By End User
Biopharma Manufacturers
Research and Development Organizations
Contract Manufacturing Organization
Regions and Countries Covered
South and Central America
Brazil, Argentina, Rest of South and Central America
Market leaders and key company profiles
General Electric Co
Merck KGaA
Pall Corp
PBS Biotech Inc
Sartorius AG
Solaris Biotechnology SRL
Thermo Fisher Scientific Inc
Get more information on this report
South & Central America Bioreactors Market Country and Regional Insights
Get more information on this report
Identical Market Reports with other Region/Countries
The List of Companies - South & Central America Bioreactors Market
1. General Electric Co2. Merck KGaA3. Pall Corp4. PBS Biotech Inc5. Sartorius AG6. Solaris Biotechnology SRL7. Thermo Fisher Scientific Inc
Krishna is a Market Research Analyst with over 4 years of experience across Life Sciences and Materials & Chemicals industries. He holds a Bachelor's degree in Pharmacy (B.Pharm.) and a Master's degree in Pharmaceutical Medicinal Chemistry (M.Pharm.). His expertise spans market intelligence, competitive benchmarking, market sizing and forecasting, primary and secondary research, and strategic consulting.
Krishna has successfully contributed to numerous syndicated and custom research engagements, delivering industry reports, market assessments, competitive analyses, and business proposals for clients across diverse sectors. With ..
Show More
Frequently Asked Questions
How big is the South & Central America Bioreactors Market?
The South & Central America Bioreactors Market is valued at US$ 246.23 Million in 2022, it is projected to reach US$ 388.31 Million by 2030.
What is the CAGR for South & Central America Bioreactors Market by (2022 - 2030)?
As per our report South & Central America Bioreactors Market, the market size is valued at US$ 246.23 Million in 2022, projecting it to reach US$ 388.31 Million by 2030. This translates to a CAGR of approximately 5.9% during the forecast period.
What segments are covered in this report?
The South & Central America Bioreactors Market report typically cover these key segments-
End User (Biopharma Manufacturers, Research and Development Organizations, Contract Manufacturing Organization)
What is the historic period, base year, and forecast period taken for South & Central America Bioreactors Market?
The historic period, base year, and forecast period can vary slightly depending on the specific market research report. However, for the South & Central America Bioreactors Market report:
Historic Period : 2020-2021
Base Year : 2022
Forecast Period : 2023-2030
Who are the major players in South & Central America Bioreactors Market?
The South & Central America Bioreactors Market is populated by several key players, each contributing to its growth and innovation. Some of the major players include:
General Electric Co
Merck KGaA
Pall Corp
PBS Biotech Inc
Sartorius AG
Solaris Biotechnology SRL
Thermo Fisher Scientific Inc
Who should buy this report?
The South & Central America Bioreactors Market report is valuable for diverse stakeholders, including:
Investors: Provides insights for investment decisions pertaining to market growth, companies, or industry insights. Helps assess market attractiveness and potential returns.
Industry Players: Offers competitive intelligence, market sizing, and trend analysis to inform strategic planning, product development, and sales strategies.
Suppliers and Manufacturers: Helps understand market demand for components, materials, and services related to concerned industry.
Researchers and Consultants: Provides data and analysis for academic research, consulting projects, and market studies.
Financial Institutions: Helps assess risks and opportunities associated with financing or investing in the concerned market.
Essentially, anyone involved in or considering involvement in the South & Central America Bioreactors Market value chain can benefit from the information contained in a comprehensive market report.


 Get Free Sample For South & Central America Bioreactors Market


