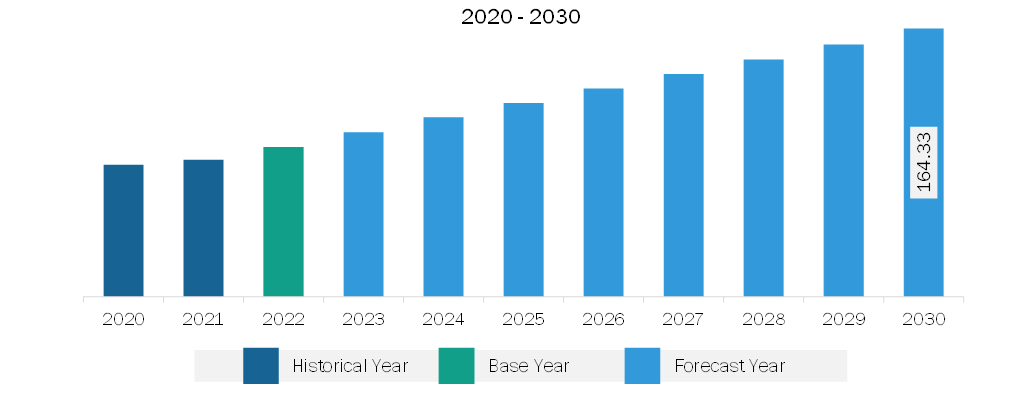
The South & Central America Aviation fuel card market was valued at US$ 91.80 million in 2022 and is expected to reach US$ 164.33 million by 2030; it is estimated to register a CAGR of 7.6% from 2022 to 2030.
Growing Adoption of Sustainable Aviation Fuel Boosts South & Central America Aviation Fuel Card Market
The need for sustainable aviation fuel is growing significantly to reduce carbon emissions in the aviation industry. Sustainable aviation fuel (SAF) is an alternative jet fuel derived from renewable and waste feedstocks that can reduce greenhouse gas emissions during its entire lifecycle. Thirty-eight of the world's largest airlines have pledged to reach net-zero emissions targets by 2050 or before, Alaska Airlines, American Airlines, Delta, JetBlue, Southwest, and United Airlines are some of them.
Aviation fuel card suppliers can expand their business by offering attractive offers and discounts on the purchase of sustainable aviation fuel. This will ultimately lead to higher adoption and usage of aviation fuel cards. Further, by partnership with fixed-based operators, fuel card service providers can expand the network to supply sustainable aviation fuel. Thus, the rise in sustainable aviation fuel transactions is anticipated to have ample opportunities for the aviation fuel card market growth during forecast period.
South & Central America Aviation Fuel Card Market Overview
The South America aviation fuel card market is still in the developing stage. The overall aviation industry in South America is growing at a notable growth rate. In Brazil, the average daily consumption of jet fuel in 2016 was 116,000 barrels, which reached 123,000 barrels in 2018. Higher fuel consumption of Brazilian airlines led to the adoption of aviation fuel cards for operational capital optimization in the aviation industry. The overall aviation and aviation-related industries in Argentina are smaller and are in the developing stage compared to Brazil. Argentina had ~35,000 passengers per day on average across 23 airports in late 2022. According to the most recent Aerocivil figures, Colombia had 22.6 million passengers in 2022, up from 19.5 million in the same period in 2019. Many aviation fuel and related companies are focusing on business expansion strategies in South American countries.
South & Central America Aviation Fuel Card Market Revenue and Forecast to 2030 (US$ Million)
South & Central America Aviation Fuel Card Market Segmentation
Based on type, the South & Central America aviation fuel card market is bifurcated into merchant and branded. The merchant segment held a larger South & Central America aviation fuel card market share in 2022.
In terms of application, the South & Central America aviation fuel card market is bifurcated into commercial and private. The commercial segment held a larger South & Central America aviation fuel card market share in 2022.
By country, the South & Central America aviation fuel card market is segmented into Brazil, Argentina, and the Rest of South & Central America. Brazil dominated the South & Central America aviation fuel card market share in 2022.
Shell Plc, BP Plc, Associated Energy Group LLC, TITAN Aviation Fuels Inc, and TotalEnergies SE are among the leading companies operating in the South & Central America aviation fuel card market.
South & Central America Aviation Fuel Card Market Strategic Insights
Get more information on this report
South & Central America Aviation Fuel Card Market Segmentation Analysis
South & Central America Aviation Fuel Card Market Report Highlights
South & Central America Aviation Fuel Card Report Scope
Report Attribute
Details
Market size in 2022
US$ 91.80 Million
Market Size by 2030
US$ 164.33 Million
CAGR (2022 - 2030)
7.6%
Historical Data
2020-2021
Forecast period
2023-2030
Segments Covered
By Type
Merchant and Branded
By Application
Commercial and Private
Regions and Countries Covered
South and Central America
Brazil, Argentina, Rest of South and Central America
Market leaders and key company profiles
Shell Plc
BP Plc
Associated Energy Group LLC
TITAN Aviation Fuels Inc
TotalEnergies SE
Get more information on this report
South & Central America Aviation Fuel Card Market Country and Regional Insights
Get more information on this report
Identical Market Reports with other Region/Countries
The List of Companies - South & Central America Aviation Fuel Card Market
1. Shell Plc 2. BP Plc3. Associated Energy Group LLC4. TITAN Aviation Fuels Inc5. TotalEnergies SE
Frequently Asked Questions
How big is the South & Central America Aviation Fuel Card Market?
The South & Central America Aviation Fuel Card Market is valued at US$ 91.80 Million in 2022, it is projected to reach US$ 164.33 Million by 2030.
What is the CAGR for South & Central America Aviation Fuel Card Market by (2022 - 2030)?
As per our report South & Central America Aviation Fuel Card Market, the market size is valued at US$ 91.80 Million in 2022, projecting it to reach US$ 164.33 Million by 2030. This translates to a CAGR of approximately 7.6% during the forecast period.
What segments are covered in this report?
The South & Central America Aviation Fuel Card Market report typically cover these key segments-
Type (Merchant and Branded)
Application (Commercial and Private)
What is the historic period, base year, and forecast period taken for South & Central America Aviation Fuel Card Market?
The historic period, base year, and forecast period can vary slightly depending on the specific market research report. However, for the South & Central America Aviation Fuel Card Market report:
Historic Period : 2020-2021
Base Year : 2022
Forecast Period : 2023-2030
Who are the major players in South & Central America Aviation Fuel Card Market?
The South & Central America Aviation Fuel Card Market is populated by several key players, each contributing to its growth and innovation. Some of the major players include:
Shell Plc
BP Plc
Associated Energy Group LLC
TITAN Aviation Fuels Inc
TotalEnergies SE
Who should buy this report?
The South & Central America Aviation Fuel Card Market report is valuable for diverse stakeholders, including:
Investors: Provides insights for investment decisions pertaining to market growth, companies, or industry insights. Helps assess market attractiveness and potential returns.
Industry Players: Offers competitive intelligence, market sizing, and trend analysis to inform strategic planning, product development, and sales strategies.
Suppliers and Manufacturers: Helps understand market demand for components, materials, and services related to concerned industry.
Researchers and Consultants: Provides data and analysis for academic research, consulting projects, and market studies.
Financial Institutions: Helps assess risks and opportunities associated with financing or investing in the concerned market.
Essentially, anyone involved in or considering involvement in the South & Central America Aviation Fuel Card Market value chain can benefit from the information contained in a comprehensive market report.


 Get Free Sample For South & Central America Aviation Fuel Card Market


