Analysis - by Component (Solution and Service), Deployment (On-Premise and Cloud), Organization Size (SMEs and Large Enterprises), and Application (Academic Research and Industrial Research & Manufacturing)
No. of Pages:85
Report Code:
BMIRE00030518
Category:
Technology, Media and Telecommunications
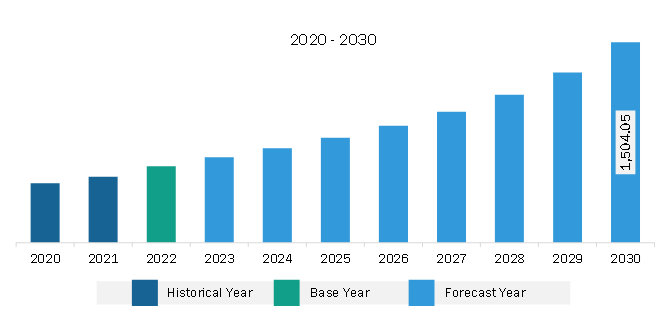
The North America photonic design automation market was valued at US$ 572.79 million in 2022 and is expected to reach US$ 1,504.05 million by 2030; it is estimated to register at a CAGR of 12.8% from 2022 to 2030.
Integration of Photonics in Electronic Design Automation (EDA) Tools Fuels North America Photonic Design Automation Market
The integration of photonics into electronic design automation (EDA) tools is a significant trend in the North America photonic design automation market. Established EDA vendors recognize the potential of the emerging photonics market and incorporate photonics-specific features and capabilities into their existing tools. This integration enables designers to seamlessly incorporate photonics components into their designs, streamlining the design process and optimizing the performance and functionality of photonic devices. By integrating photonics into EDA tools, designers can leverage familiar design environments and workflows, reducing the learning curve associated with specialized photonic design tools. The integration of photonics into EDA tools also facilitates the convergence of electronics and photonics, enabling the development of integrated electronic-photonic circuits. This convergence is crucial for the advancement of technologies such as silicon photonics, where the sharing of tools, processes, and simulation models between photonics and IC design accelerates the development of photonic design automation. Overall, the integration of photonics into EDA tools reflects the industry's recognition of the growing importance of photonics and the need for efficient design processes and optimization techniques in the photonic field. It enables designers to harness the potential of photonics and seamlessly incorporate it into their electronic designs.
North America Photonic Design Automation Market Overview
The market in North America is segmented into the US and Canada. North America is a key player in the global photonic design automation market, with a strong presence of leading technology companies, research institutions, and a robust manufacturing ecosystem. This region has witnessed significant growth and adoption of photonic design automation technologies across various industries. The rising need for high-speed and high-bandwidth communication networks is a key driver for the photonic design automation market in North America. The strong collaboration between academia and industry in the region stimulates the advancement of cutting-edge algorithms, simulation tools, and design methodologies, ensuring that companies remain at the forefront of technological progress. Photonic design automation tools play a crucial role in designing and optimizing these devices, ensuring their performance and reliability.
Moreover, North America has a thriving research and development landscape, with renowned universities and research institutions dedicated to photonics and related fields. These institutions actively collaborate with industry players to develop cutting-edge technologies and drive innovation in the photonic design automation market. The development of advanced algorithms, simulation tools, and design methodologies is facilitated by robust academic-industry partnerships in the region, allowing companies to remain at the cutting edge of technological advancements. In terms of market players, North America is home to several major companies that offer photonic design automation solutions. These companies leverage their expertise in software development, semiconductor design, and photonics to provide comprehensive design automation tools and services. The North America market exhibits a dynamic and innovative business environment, comprising a blend of established industry leaders and emerging startups. Furthermore, the region's emphasis on research and development in leading-edge technologies such as the Internet of Things (IoT), machine learning (ML), and artificial intelligence (AI) contributes to its competitive advantage. The integration of these advanced technologies with photonic design automation empowers the industry with enhanced design capabilities, optimization, and automation of the design process.
North America Photonic Design Automation Market Revenue and Forecast to 2030 (US$ Million)
North America Photonic Design Automation Market Segmentation
The North America photonic design automation market is segmented based on component, deployment, organization size, application, and country.
Based on component, the North America photonic design automation market photonic design automation market is bifurcated into solution and service. The solution segment held a larger share in 2022.
In terms of deployment, the North America photonic design automation market photonic design automation market is bifurcated into on-premise and cloud. The on-premise segment held a larger share in 2022.
By organization size, the North America photonic design automation market photonic design automation market is bifurcated into SMEs and large enterprises. The large enterprises segment held a larger share in 2022.
In terms of application, the North America photonic design automation market photonic design automation market is bifurcated into academic research and industrial research & manufacturing. The industrial research & manufacturing segment held a larger share in 2022.
Based on country, the North America photonic design automation market is categorized into the US and Canada. The US dominated the North America photonic design automation market in 2022.
Ansys Inc, VPIphotonics GmbH, Optiwave Systems Inc, Luceda Photonics, Cadence Design Systems Inc, Siemens AG, Synopsys Inc, AIM Photonics Inc, and SystemLab Inc are some of the leading companies operating in the North America photonic design automation market.
North America Photonic Design Automation Market Strategic Insights
Get more information on this report
North America Photonic Design Automation Market Segmentation Analysis
North America Photonic Design Automation Market Report Highlights
North America Photonic Design Automation Report Scope
Report Attribute
Details
Market size in 2022
US$ 572.79 Million
Market Size by 2030
US$ 1,504.05 Million
CAGR (2022 - 2030)
12.8%
Historical Data
2020-2021
Forecast period
2023-2030
Segments Covered
By Component
Solution and Service
By Deployment
On-Premise
Cloud
By Application
Academic Research and Industrial Research & Manufacturing
Regions and Countries Covered
North America
US, Canada, Mexico
Market leaders and key company profiles
Ansys Inc
VPIphotonics GmbH
Optiwave Systems Inc
Luceda Photonics
Cadence Design Systems Inc
Siemens AG
Synopsys Inc
AIM Photonics Inc
SystemLab Inc
Get more information on this report
North America Photonic Design Automation Market Country and Regional Insights
Get more information on this report
Identical Market Reports with other Region/Countries
The List of Companies - North America Photonic Design Automation Market
1. Ansys Inc2. VPIphotonics GmbH3. Optiwave Systems Inc4. Luceda Photonics5. Cadence Design Systems Inc6. Siemens AG7. Synopsys Inc8. AIM Photonics Inc9. SystemLab Inc
Frequently Asked Questions
How big is the North America Photonic Design Automation Market?
The North America Photonic Design Automation Market is valued at US$ 572.79 Million in 2022, it is projected to reach US$ 1,504.05 Million by 2030.
What is the CAGR for North America Photonic Design Automation Market by (2022 - 2030)?
As per our report North America Photonic Design Automation Market, the market size is valued at US$ 572.79 Million in 2022, projecting it to reach US$ 1,504.05 Million by 2030. This translates to a CAGR of approximately 12.8% during the forecast period.
What segments are covered in this report?
The North America Photonic Design Automation Market report typically cover these key segments-
Component (Solution and Service)
Deployment (On-Premise, Cloud)
Application (Academic Research and Industrial Research & Manufacturing)
What is the historic period, base year, and forecast period taken for North America Photonic Design Automation Market?
The historic period, base year, and forecast period can vary slightly depending on the specific market research report. However, for the North America Photonic Design Automation Market report:
Historic Period : 2020-2021
Base Year : 2022
Forecast Period : 2023-2030
Who are the major players in North America Photonic Design Automation Market?
The North America Photonic Design Automation Market is populated by several key players, each contributing to its growth and innovation. Some of the major players include:
Ansys Inc
VPIphotonics GmbH
Optiwave Systems Inc
Luceda Photonics
Cadence Design Systems Inc
Siemens AG
Synopsys Inc
AIM Photonics Inc
SystemLab Inc
Who should buy this report?
The North America Photonic Design Automation Market report is valuable for diverse stakeholders, including:
Investors: Provides insights for investment decisions pertaining to market growth, companies, or industry insights. Helps assess market attractiveness and potential returns.
Industry Players: Offers competitive intelligence, market sizing, and trend analysis to inform strategic planning, product development, and sales strategies.
Suppliers and Manufacturers: Helps understand market demand for components, materials, and services related to concerned industry.
Researchers and Consultants: Provides data and analysis for academic research, consulting projects, and market studies.
Financial Institutions: Helps assess risks and opportunities associated with financing or investing in the concerned market.
Essentially, anyone involved in or considering involvement in the North America Photonic Design Automation Market value chain can benefit from the information contained in a comprehensive market report.


 Get Free Sample For North America Photonic Design Automation Market


