Analysis - by Type (Reduced, Atomized, and Electrolytic), Manufacturing Process (Physical [Atomization and Electro Deposition], Chemical [Reduction and Decomposition], and Mechanical), Grade (? 99.0% and ? 99.1%), and End-Use Industry (Paints & Coatings, Additive Manufacturing, Medical, Soft Magnetic Products, Metallurgy [Compound Brazing, Compound Sintering, Compound Welding, and Others], and Others)
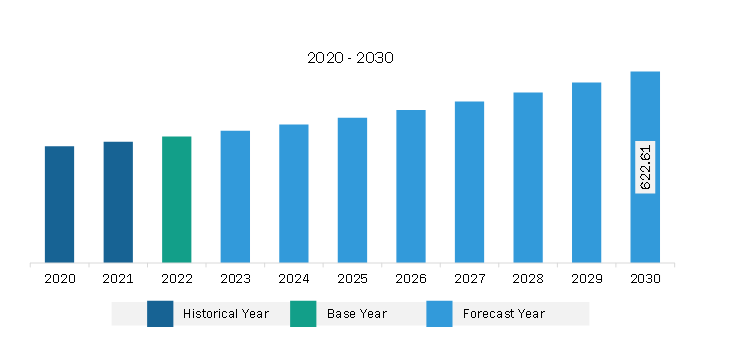
The North America iron powder market was valued at US$ 411.18 million in 2022 and is expected to reach US$ 622.61 million by 2030; it is estimated to grow at a CAGR of 5.3% from 2022 to 2030.
Flourishment of Automotive Industry Fuels North America Iron Powder Market
The automotive industry heavily relies on iron powder as it is a fundamental raw material in the field of powder metallurgy. This manufacturing process involves shaping and sintering metal powders to create intricate parts. Automotive manufacturers increasingly turn to powder metallurgy for the production of components such as gears, bearings, and bushings, as it offers cost-effective, precise, and resource-efficient manufacturing solutions. In addition, in recent years, the automotive sector has heavily invested in reducing the weight of vehicles to enhance fuel efficiency and reduce emissions. Iron powder, when integrated into metal matrix composites and other advanced materials, can contribute to the development of lightweight components that maintain structural integrity. These components are integral to achieving the industry's lightweight objectives, resulting in more fuel-efficient vehicles and a reduced carbon footprint. As per the data of the Organisation Internationale des Constructeurs d'Automobiles (OICA), countries in North America, South America, and Central America recorded production of over 16.1 million commercial and passenger cars in 2021, and the production has grown by 10% and registered over 17.7 million commercial and passenger cars in 2022.
Companies operating in the automotive sector are investing heavily in automobile manufacturing to increase production and sales. Hyundai Motor Co announced in October 2022 that a new US$ 5.54 billion Georgia electric vehicle and battery plant could begin production in 2024 and eventually produce 500,000 vehicles annually. As the automotive industry experiences a transformative shift toward electric vehicles (EVs), iron powder's role becomes even more crucial. Electric motors used in EVs often rely on iron powder for the production of soft magnetic cores, which are essential for the motors' efficiency and performance. According to the International Energy Agency's annual Global Electric Vehicle Outlook, over 10 million electric cars were sold worldwide in 2022, and sales are projected to grow by another 35% in 2023 to reach 14 million. As the automotive parts sector continues to evolve and innovate, iron powder is poised to remain a fundamental material for the production of high-quality, efficient, and environmentally responsible automotive components.
North America Iron Powder Market Overview
The North America iron powder market is segmented into the US, Canada, and Mexico. The North America iron powder market growth is mainly driven by the growing application of iron powder in the automotive industry, particularly due to electric vehicle (EV) revolution. With many automakers transitioning to EV production, the demand for iron powder has surged, as it is a crucial component in electric motor manufacturing and battery technology. For instance, Tesla's expansion of its Gigafactories in the US has resulted in a substantial uptick in the consumption of iron powder, reflecting the robust growth of the EV market in the region. For instance, Kymera International offers air-atomized copper powder, which finds applications such as friction for brake pads in automobiles, bi-metallic bearings for automotive, brazing, porous metal filtration, PM parts, thermal spray coatings, synthetic industrial diamond manufacturing, and others. Iron Powder is also used in construction sector to enhance the structural integrity and sustainability of buildings. In New York and Toronto, iron powder is integrated into advanced construction materials to create more energy-efficient and eco-friendly structures, further driving its demand. Moreover, environmental regulations have played a pivotal role in shaping the North America iron powder market. North American countries are increasingly adopting eco-friendly manufacturing processes, including those related to iron powder production. Companies are investing in technologies that reduce emissions and improve energy efficiency in their manufacturing plants, responding to the growing emphasis on sustainability in the market.
North America Iron Powder Market Revenue and Forecast to 2030 (US$ Million)
North America Iron Powder Market Segmentation
The North America iron powder market is segmented based on type, grade, manufacturing process, end-use industry, and country.
Based on type, the North America iron powder market is segmented into reduced, atomized, and electrolytic. The atomized segment held the largest share in 2022.
By manufacturing process, the North America iron powder market is categorized into physical, chemical, and mechanical. The physical segment held the largest share in 2022. The physical segment is further subsegmented into atomization and electro deposition. The chemical segment is further subsegmented into reduction and decomposition.
By grade, the North America iron powder market is bifurcated into ≤ 99.0% and ≥ 99.1%. The ≤ 99.0% segment held a larger share in 2022.
By end-use industry, the North America iron powder market is segmented into paints and coatings, additive manufacturing, medical, soft magnetic products, metallurgy, and others. The metallurgy segment held the largest share in 2022. The metallurgy segment is further subsegmented into compound brazing, compound sintering, compound welding, and others.
Based on country, the North America iron powder market is segmented into the US, Canada, and Mexico. The US dominated the North America iron powder market in 2022.
Rio Tinto Metal Powders, American Elements Inc, Industrial Metal Powders (India) Pvt Ltd, CNPC Powder North America Inc, Ashland Inc, BASF SE, Hoganas AB, JFE Steel Corp, Reade International Corp, and Kobe Steel Ltd are some of the leading companies operating in the North America iron powder market.
North America Iron Powder Market Strategic Insights
Get more information on this report
North America Iron Powder Market Segmentation Analysis
North America Iron Powder Market Report Highlights
North America Iron Powder Report Scope
Report Attribute
Details
Market size in 2022
US$ 411.18 Million
Market Size by 2030
US$ 622.61 Million
CAGR (2022 - 2030)
5.3%
Historical Data
2020-2021
Forecast period
2023-2030
Segments Covered
By Type
Reduced
Atomized
Electrolytic
By Manufacturing Process
Physical
Chemical
Mechanical
By Grade
99.0%
99.1%
By End-Use Industry
Paints & Coatings
Additive Manufacturing
Medical
Soft Magnetic Products
Metallurgy
Regions and Countries Covered
North America
US, Canada, Mexico
Market leaders and key company profiles
American Elements Inc
Ashland Inc
BASF SE
CNPC Powder North America Inc
Hoganas AB
Industrial Metal Powders (India) Pvt Ltd
JFE Steel Corp
Kobe Steel Ltd
Reade International Corp
Rio Tinto Metal Powders
Get more information on this report
North America Iron Powder Market Country and Regional Insights
Get more information on this report
Identical Market Reports with other Region/Countries
The List of Companies - North America Iron Powder Market
1. American Elements Inc 2. Ashland Inc3. BASF SE4. CNPC Powder North America Inc5. Hoganas AB6. Industrial Metal Powders (India) Pvt Ltd7. JFE Steel Corp8. Kobe Steel Ltd9. Reade International Corp10. Rio Tinto Metal Powders
Frequently Asked Questions
How big is the North America Iron Powder Market?
The North America Iron Powder Market is valued at US$ 411.18 Million in 2022, it is projected to reach US$ 622.61 Million by 2030.
What is the CAGR for North America Iron Powder Market by (2022 - 2030)?
As per our report North America Iron Powder Market, the market size is valued at US$ 411.18 Million in 2022, projecting it to reach US$ 622.61 Million by 2030. This translates to a CAGR of approximately 5.3% during the forecast period.
What segments are covered in this report?
The North America Iron Powder Market report typically cover these key segments-
Type (Reduced, Atomized, Electrolytic)
Manufacturing Process (Physical, Chemical, Mechanical)
Grade (99.0%, 99.1%)
End-Use Industry (Paints & Coatings, Additive Manufacturing, Medical, Soft Magnetic Products, Metallurgy)
What is the historic period, base year, and forecast period taken for North America Iron Powder Market?
The historic period, base year, and forecast period can vary slightly depending on the specific market research report. However, for the North America Iron Powder Market report:
Historic Period : 2020-2021
Base Year : 2022
Forecast Period : 2023-2030
Who are the major players in North America Iron Powder Market?
The North America Iron Powder Market is populated by several key players, each contributing to its growth and innovation. Some of the major players include:
American Elements Inc
Ashland Inc
BASF SE
CNPC Powder North America Inc
Hoganas AB
Industrial Metal Powders (India) Pvt Ltd
JFE Steel Corp
Kobe Steel Ltd
Reade International Corp
Rio Tinto Metal Powders
Who should buy this report?
The North America Iron Powder Market report is valuable for diverse stakeholders, including:
Investors: Provides insights for investment decisions pertaining to market growth, companies, or industry insights. Helps assess market attractiveness and potential returns.
Industry Players: Offers competitive intelligence, market sizing, and trend analysis to inform strategic planning, product development, and sales strategies.
Suppliers and Manufacturers: Helps understand market demand for components, materials, and services related to concerned industry.
Researchers and Consultants: Provides data and analysis for academic research, consulting projects, and market studies.
Financial Institutions: Helps assess risks and opportunities associated with financing or investing in the concerned market.
Essentially, anyone involved in or considering involvement in the North America Iron Powder Market value chain can benefit from the information contained in a comprehensive market report.


 Get Free Sample For North America Iron Powder Market


