Analysis - by Operation Type (Cylindrical Worm Gear and Single and Double Enveloping Worm Gear), Product Type (Housed Units, Gearsets, and High Speed Worms), and Material Type (Stainless Steel, Cast Iron, Aluminum, and Others)
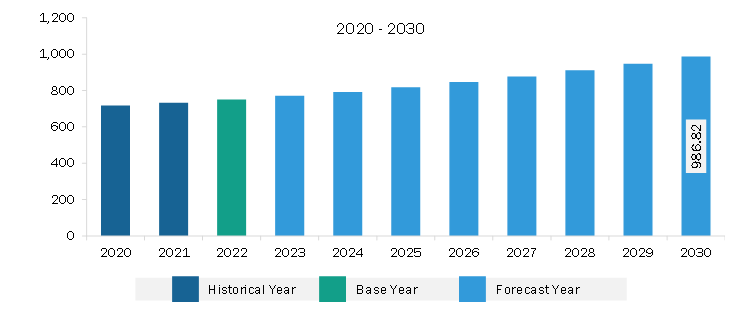
The Europe worm gear drives market was valued at US$ 750.87 million in 2022 and is expected to reach US$ 986.82 million by 2030; it is estimated to register a CAGR of 3.5% from 2022 to 2030.
Growing Elevator and Escalator Installations Due to Increasing Construction Activities Drive Europe Worm Gear Drives Market
Worm gear drives are commonly used in elevators and escalators owing to their fast braking or stopping abilities. Moreover, their compact size and ratio render them suitable for these applications, they can stop and hold a weight and prevent a reverse motion. These technical advantages help regulate the elevator's speed and prevent its elevator from a free fall. Growing elevator and escalator installations due to increased construction activities in developed and developing nations is one of the factors that is driving the demand for worm gear drives. Approximately half of the 7.8 billion people worldwide currently reside in cities and urban regions, with an additional 2.5 billion predicted to move in the next 20 to 25 years. In crowded places where empty lands are scarce, high-rise structures-especially residential ones-have shown to be advantageous. There is an increase in the number of high-rise buildings owing to population growth. Builders construct taller structures that can accommodate more individuals on a lesser footprint. The rising number of high-rise buildings is propelling the installation of elevators and escalators.
Europe Worm Gear Drives Market Overview
Industrial prowess in key economies such as Germany, France, the UK, Italy, and Russia favors the worm gear drive market growth in Europe. The manufacturing sector in the UK, highlighted by a US$ 30.81 billion (7%) increase in manufacturers' product sales in 2022, plays a crucial role in the European worm gear drive market. Food manufacturing, metals, and apparel industries, among others, present diverse application areas for worm gear drives in the UK. The resilience and expansion of the UK manufacturing sector signify a growing market for efficient power transmission systems. Italy is the second-largest manufacturing country in Europe. Machinery, fashion, automotive parts, and pharmaceutical businesses contribute to a thriving manufacturing sector in this country. The record installations of robots in Italy, particularly in 2022, indicate a growing need for advanced components such as worm gear drives in manufacturing processes. France is one of the leading manufacturing countries in Europe. The robust performance of the French automotive industry, fashion sector, and machinery manufacturing underscores a consistent demand for worm gear drives and other precision components. The emphasis on industrial restructuring and technological advancements in France contributes to the growing adoption of advanced power transmission solutions.
Europe Worm Gear Drives Market Revenue and Forecast to 2030 (US$ Million)
Based on operation type, the Europe worm gear drives market is bifurcated into cylindrical worm gears and single and double enveloping worm gears. The cylindrical worm gears segment held a larger market share in 2022.
In terms of product type, the Europe worm gear drives market is categorized into housed units, gearsets, and high speed worms. The gearsets segment held the largest market share in 2022.
By material type, the Europe worm gear drives market is segmented into stainless steel, cast iron, aluminum, and others. The stainless steel segment held the largest market share in 2022.
By country, the Europe worm gear drives market is segmented into Germany, France, Italy, the UK, Russia, and the Rest of Europe. Germany dominated the Europe worm gear drives market share in 2022.
Kohara Gear Industry Co Ltd, Nozag AG, RA Rodriguez (UK) Ltd, BJ-Gear AS, and The Timken Co are some of the leading companies operating in the Europe worm gear drives market.
Europe Worm Gear Drives Market Strategic Insights
Get more information on this report
Europe Worm Gear Drives Market Segmentation Analysis
Europe Worm Gear Drives Market Report Highlights
Europe Worm Gear Drives Report Scope
Report Attribute
Details
Market size in 2022
US$ 750.87 Million
Market Size by 2030
US$ 986.82 Million
CAGR (2022 - 2030)
3.5%
Historical Data
2020-2021
Forecast period
2023-2030
Segments Covered
By Operation Type
Cylindrical Worm Gear and Single and Double Enveloping Worm Gear
By Product Type
Housed Units
Gearsets
High Speed Worms
Regions and Countries Covered
Europe
UK, Germany, France, Russia, Italy, Rest of Europe
Market leaders and key company profiles
Kohara Gear Industry Co Ltd.
Nozag AG.
RA Rodriguez (UK) Ltd.
BJ-Gear AS.
The Timken Co.
Get more information on this report
Europe Worm Gear Drives Market Country and Regional Insights
Get more information on this report
Identical Market Reports with other Region/Countries
The List of Companies - Europe Worm Gear Drives Market
1. Kohara Gear Industry Co Ltd.2. Nozag AG.3. RA Rodriguez (UK) Ltd.4. BJ-Gear AS.5. The Timken Co.
Frequently Asked Questions
How big is the Europe Worm Gear Drives Market?
The Europe Worm Gear Drives Market is valued at US$ 750.87 Million in 2022, it is projected to reach US$ 986.82 Million by 2030.
What is the CAGR for Europe Worm Gear Drives Market by (2022 - 2030)?
As per our report Europe Worm Gear Drives Market, the market size is valued at US$ 750.87 Million in 2022, projecting it to reach US$ 986.82 Million by 2030. This translates to a CAGR of approximately 3.5% during the forecast period.
What segments are covered in this report?
The Europe Worm Gear Drives Market report typically cover these key segments-
Operation Type (Cylindrical Worm Gear and Single and Double Enveloping Worm Gear)
Product Type (Housed Units, Gearsets, High Speed Worms)
What is the historic period, base year, and forecast period taken for Europe Worm Gear Drives Market?
The historic period, base year, and forecast period can vary slightly depending on the specific market research report. However, for the Europe Worm Gear Drives Market report:
Historic Period : 2020-2021
Base Year : 2022
Forecast Period : 2023-2030
Who are the major players in Europe Worm Gear Drives Market?
The Europe Worm Gear Drives Market is populated by several key players, each contributing to its growth and innovation. Some of the major players include:
Kohara Gear Industry Co Ltd.
Nozag AG.
RA Rodriguez (UK) Ltd.
BJ-Gear AS.
The Timken Co.
Who should buy this report?
The Europe Worm Gear Drives Market report is valuable for diverse stakeholders, including:
Investors: Provides insights for investment decisions pertaining to market growth, companies, or industry insights. Helps assess market attractiveness and potential returns.
Industry Players: Offers competitive intelligence, market sizing, and trend analysis to inform strategic planning, product development, and sales strategies.
Suppliers and Manufacturers: Helps understand market demand for components, materials, and services related to concerned industry.
Researchers and Consultants: Provides data and analysis for academic research, consulting projects, and market studies.
Financial Institutions: Helps assess risks and opportunities associated with financing or investing in the concerned market.
Essentially, anyone involved in or considering involvement in the Europe Worm Gear Drives Market value chain can benefit from the information contained in a comprehensive market report.


 Get Free Sample For Europe Worm Gear Drives Market


