Analysis - by Type (Fully Rugged Tablet, Semi Rugged Tablet, and Ultra Rugged Tablet), Operating System (Android, Windows, and iOS), and Application (Aerospace & Defense, Automotive, Construction, Energy & Utilities, Manufacturing, Oil & Gas, and Others)
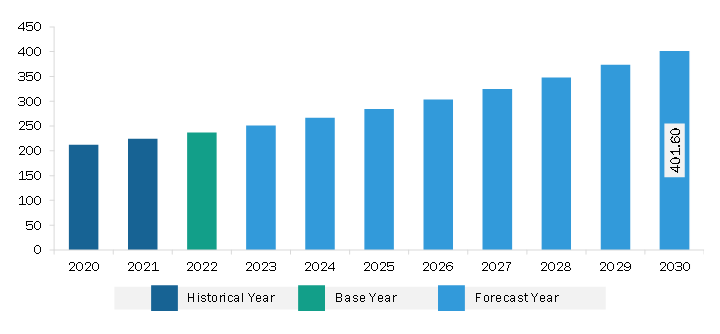
The Europe rugged tablet market was valued at US$ 237.04 million in 2022 and is expected to reach US$ 401.60 million by 2030; it is estimated to grow at a CAGR of 6.8% from 2022 to 2030.
Rising Demand from Industrial Sector Boosts Europe Rugged Tablet Market
The industrial sector, including manufacturing, metal fabrication, construction, and automotive, is growing year on year. The rugged tablet has several applications in the industrial sector. A rugged tablet, also known as an industrial-grade ruggedized tablet or an industrial tablet PC, is a specialized tablet computer built to survive harsh climatic conditions and demanding operations in industrial environments. Rugged tablets are frequently used in industrial manufacturing in the roughest situations, such as on the manufacturing floor, to manage inventories, check equipment performance, and follow production schedules. They are perfect for use in demanding industrial conditions because of their strength and waterproofness, which can endure dust, debris, and liquid exposure. Ratings for durability are an essential factor in an industrial manufacturing environment.
Several players provide rugged tablets for the construction utilities manufacturing sectors. For instance, Zebra Technologies Corporation provides the Zebra Xpad l10 rugged tablet to enhance industry workflow. Thus, rising demand from the industrial sector propels the growth of the rugged tablet market.
Europe Rugged Tablet Market Overview
The Europe rugged tablet market is segmented into Germany, France, Italy, the UK, Russia, and the Rest of Europe. Manufacturing is growing in Europe. According to Eurostat, the EU's industrial production increased by 8% in 2021 compared to 2020, and it is expected to expand by 5% in 2022 compared to 2021. Several players across Europe are manufacturing rugged tablets. In February 2023, Winmate Inc., a manufacturer of rugged tablets for field work, introduced two new rugged tablets-M101TG and M116TG-powered by Intel 11th generation CPU Tiger Lake to suit smart manufacturing demands of harsh solutions. Moreover, several utility industries across Europe adopt rugged tablets for asset management and customer support. In September 2023, Thames Water, the UK's largest private utility company, announced the selection of ZX10 fully rugged Android tablet that Getac manufactured. ZX10's fully rugged tablet, combined with the detachable keyboard and rotating hand strap, will enable Thames Water's field engineers to take a proactive approach to asset management and customer support, using smart technologies to deliver more all-important first-time fixes. Thus, the adoption of rugged tablets by various industries propels the rugged tablet market growth in Europe.
Europe Rugged Tablet Market Revenue and Forecast to 2030 (US$ Million)
Europe Rugged Tablet Market Segmentation
The Europe rugged tablet market is segmented based on type, operating system, application, and country. Based on type, the Europe rugged tablet market is segmented into fully rugged tablet, semi rugged tablet, and ultra rugged tablet. The fully rugged tablet segment held the largest market share in 2022.
In terms of operating system, the Europe rugged tablet market is segmented into android, windows, and iOS. The android segment held the largest market share in 2022.
By application, the Europe rugged tablet market is segmented into aerospace & defense, automotive, construction, energy & utilities, manufacturing, oil & gas, and others. The aerospace & defense segment held the largest market share in 2022.
Based on country, the Europe rugged tablet market is segmented into the UK, Germany, France, Italy, Russia, and the Rest of Europe. Germany dominated the Europe rugged tablet market share in 2022.
AAEON Technology Inc, Dell Technologies Inc, Panasonic Holdings Corp, Getac Holdings Corp, MilDef Group AB, NEXCOM International Co Ltd, Zebra Technologies Corp, and Kontron AG are some of the leading players operating in the Europe rugged tablet market.
Europe Rugged Tablet Market Strategic Insights
Get more information on this report
Europe Rugged Tablet Market Segmentation Analysis
Europe Rugged Tablet Market Report Highlights
Europe Rugged Tablet Report Scope
Report Attribute
Details
Market size in 2022
US$ 237.04 Million
Market Size by 2030
US$ 401.60 Million
CAGR (2022 - 2030)
6.8%
Historical Data
2020-2021
Forecast period
2023-2030
Segments Covered
By Type
Fully Rugged Tablet
Semi Rugged Tablet
Ultra Rugged Tablet
By Operating System
Android
Windows
iOS
By Application
Aerospace & Defense
Automotive
Construction
Energy & Utilities
Manufacturing
Oil & Gas
Regions and Countries Covered
Europe
UK, Germany, France, Russia, Italy, Rest of Europe
Market leaders and key company profiles
AAEON Technology Inc
Dell Technologies Inc
Panasonic Holdings Corp
Getac Holdings Corp
MilDef Group AB
NEXCOM International Co Ltd
Zebra Technologies Corp
Kontron AG
Get more information on this report
Europe Rugged Tablet Market Country and Regional Insights
Get more information on this report
Identical Market Reports with other Region/Countries
The List of Companies - Europe Rugged Tablet Market
1. AAEON Technology Inc2. Dell Technologies Inc3. Panasonic Holdings Corp4. Getac Holdings Corp5. MilDef Group AB6. NEXCOM International Co Ltd7. Zebra Technologies Corp8. Kontron AG
Frequently Asked Questions
How big is the Europe Rugged Tablet Market?
The Europe Rugged Tablet Market is valued at US$ 237.04 Million in 2022, it is projected to reach US$ 401.60 Million by 2030.
What is the CAGR for Europe Rugged Tablet Market by (2022 - 2030)?
As per our report Europe Rugged Tablet Market, the market size is valued at US$ 237.04 Million in 2022, projecting it to reach US$ 401.60 Million by 2030. This translates to a CAGR of approximately 6.8% during the forecast period.
What segments are covered in this report?
The Europe Rugged Tablet Market report typically cover these key segments-
Type (Fully Rugged Tablet, Semi Rugged Tablet, Ultra Rugged Tablet)
What is the historic period, base year, and forecast period taken for Europe Rugged Tablet Market?
The historic period, base year, and forecast period can vary slightly depending on the specific market research report. However, for the Europe Rugged Tablet Market report:
Historic Period : 2020-2021
Base Year : 2022
Forecast Period : 2023-2030
Who are the major players in Europe Rugged Tablet Market?
The Europe Rugged Tablet Market is populated by several key players, each contributing to its growth and innovation. Some of the major players include:
AAEON Technology Inc
Dell Technologies Inc
Panasonic Holdings Corp
Getac Holdings Corp
MilDef Group AB
NEXCOM International Co Ltd
Zebra Technologies Corp
Kontron AG
Who should buy this report?
The Europe Rugged Tablet Market report is valuable for diverse stakeholders, including:
Investors: Provides insights for investment decisions pertaining to market growth, companies, or industry insights. Helps assess market attractiveness and potential returns.
Industry Players: Offers competitive intelligence, market sizing, and trend analysis to inform strategic planning, product development, and sales strategies.
Suppliers and Manufacturers: Helps understand market demand for components, materials, and services related to concerned industry.
Researchers and Consultants: Provides data and analysis for academic research, consulting projects, and market studies.
Financial Institutions: Helps assess risks and opportunities associated with financing or investing in the concerned market.
Essentially, anyone involved in or considering involvement in the Europe Rugged Tablet Market value chain can benefit from the information contained in a comprehensive market report.


 Get Free Sample For Europe Rugged Tablet Market


