Analysis - by Product (Passenger Vehicle and Utility Vehicle), End User (Golf Courses, Hotels & Resorts, Airports, Residential & Commercial, Premises, and Others), and Vehicle Type (Golf Carts, Commercial Turf Utility Vehicles, Industrial Utility Vehicles, and Personal Mobility Vehicles)
The Asia Pacific low-speed electric vehicle market was valued at US$ 1,670.98 million in 2022 and is expected to reach US$ 2,823.95 million by 2030; it is estimated to register a CAGR of 6.8% from 2022 to 2030.
Usage of Low-speed Electric Vehicles in Different Sectors Fuels Asia Pacific Low-Speed Electric Vehicle Market
The changing world scenario towards mitigating environmental pollution has influenced the use of low-speed electric vehicles in different sectors such as defense, construction, and mining. The objective of attaining net zero carbon emissions in different countries is promoting the adoption of sustainable alternatives, fueling the usage of low-speed electric vehicles for carrying goods passengers for shorter distances. Mini excavators, dump trucks and small wheel loaders are some of the examples of utility scale low-speed electric vehicle used in construction and mining sector. The utility-scale application of electric vehicles in a few prime sectors such as mining, defense, and construction, is likely to offer new opportunities for the Asia Pacific low-speed electric vehicle market players in the coming years.
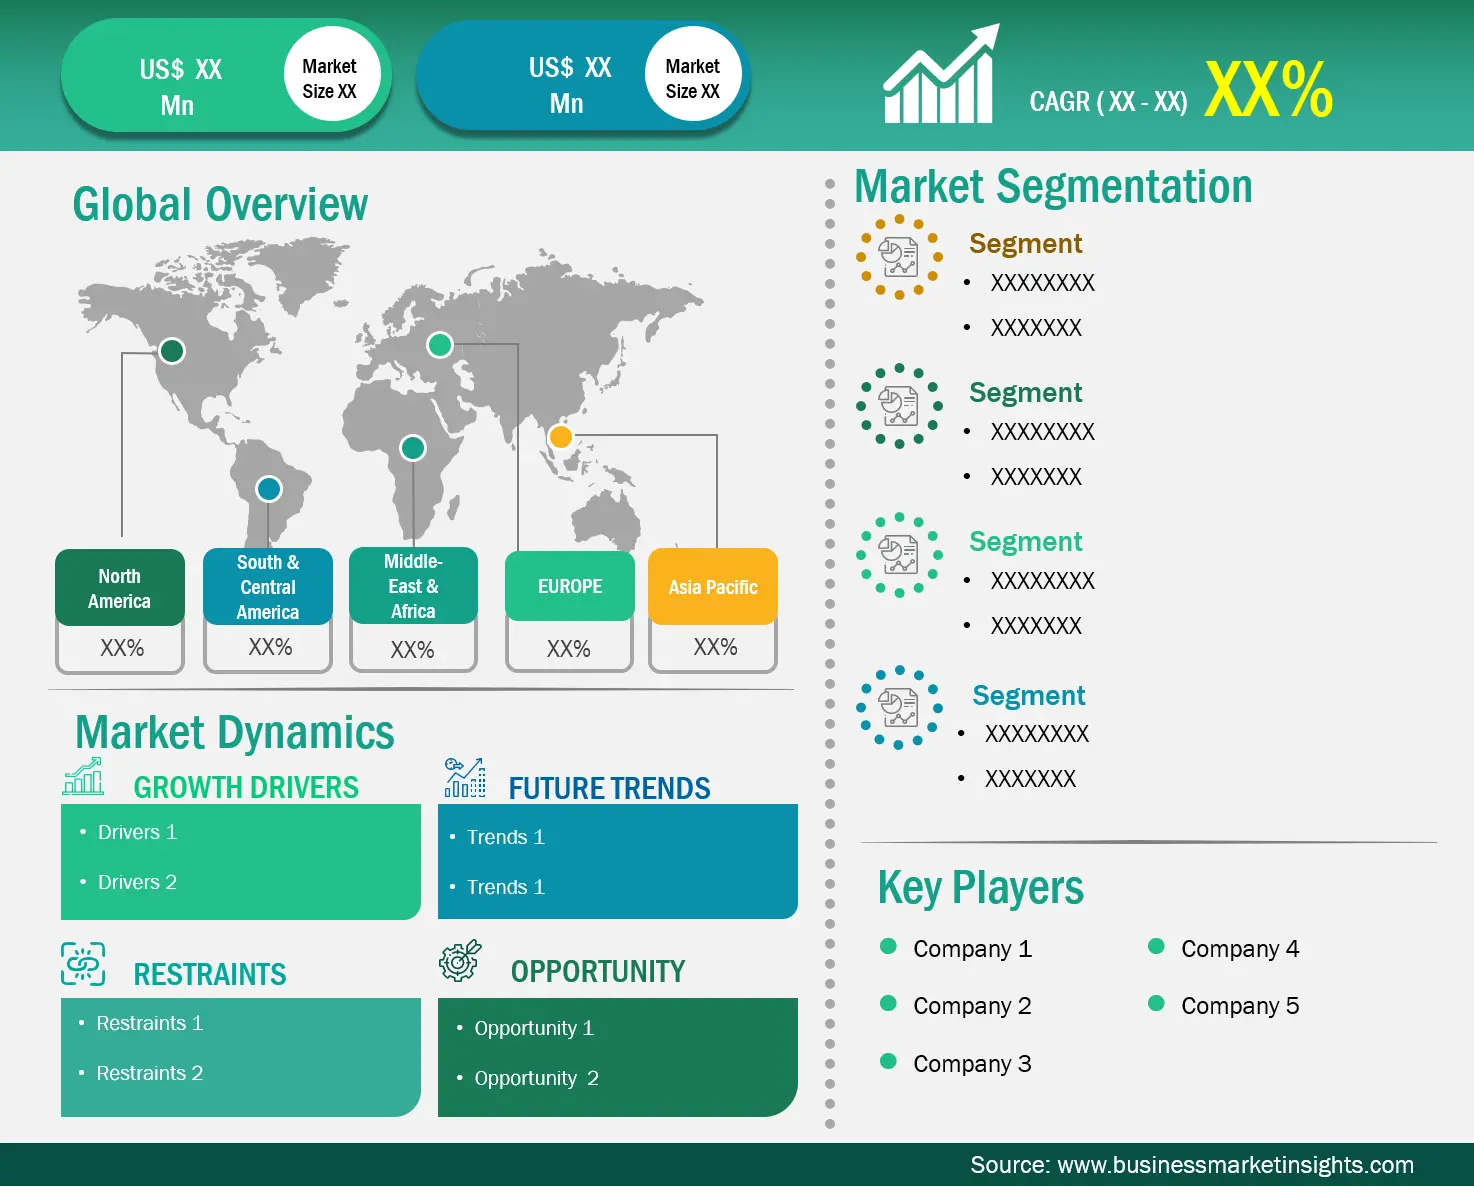
Asia Pacific Low-Speed Electric Vehicle Market Overview
The year 2022 marked a significant turning point for electric car sales in emerging markets, particularly in India, Thailand, and Indonesia. Collectively, these nations experienced an impressive surge, with electric car sales more than tripling compared to the previous year, reaching a substantial figure of 80,000 units. Thailand emerged as a standout performer, with electric cars accounting for slightly over 3% of the total vehicle sales in 2022. India and Indonesia also demonstrated notable progress, with both countries averaging around 1.5% of their total vehicle sales being electric cars during the same period.
Asia Pacific Low-Speed Electric Vehicle Market Revenue and Forecast to 2030 (US$ Million)
Asia Pacific Low-Speed Electric Vehicle Market Segmentation
The Asia Pacific low-speed electric vehicle market is bifurcated based on product, end user, vehicle type, and country. Based on product, the Asia Pacific low-speed electric vehicle market is bifurcated into passenger vehicle and utility vehicle. The passenger vehicle segment held a larger market share in 2022.
In terms of end user, the Asia Pacific low-speed electric vehicle market is segmented into golf courses, hotels & resorts, airports, residential & commercial, premises, and others. The golf courses segment held the largest market share in 2022.
By vehicle type, the Asia Pacific low-speed electric vehicle market is segmented into golf carts, commercial turf utility vehicles, industrial utility vehicles, and personal mobility vehicles. The golf carts segment held the largest market share in 2022.
Based on country, the Asia Pacific low-speed electric vehicle market is segmented into China, Japan, India, Australia, South Korea, and the Rest of Asia Pacific. China dominated the Asia Pacific low-speed electric vehicle market share in 2022.
Evfarm India Pvt Ltd, Autopower Drives (India) Ltd, Navya SA, Taizhou EBU Industry & Trade Co Ltd, Yamaha Motor Co Ltd, Anhui Airuite New Energy Special Purpose Vehicle Co Ltd, Guangdong Lvtong New Energy Electric Vehicle Technology Co Ltd, Yamaha Golf-Car Co, XunHu, Xiamen Dalle Electric Car Co Ltd, Tomberlin, BOLDLY Inc, Nandan GSE Pvt Ltd, Renault SA, Deere & Co, Suzhou Eagle Electric Vehicle Manufacturing Co Ltd, Saera Electric Auto Ltd, Shenzhen Aoxiang Industrial Development Co Ltd, Cengocar, Guangzhou Langqing Electric Car Co Ltd, HDK Electric Vehicle Corp, Lohr SA, Parmaker Holdings Pty Ltd, Prevalence Green Solutions Pvt Ltd, Roots Industries India Ltd, Kinghike Vehicle Co Ltd, Lawat Motors LLP, Marshell Green Power, Polaris Inc, EasyMile SAS, Vayve Mobility Pvt Ltd, Electric Railway (Thailand) PCL, Kinetic Green Energy & Power Solutions Ltd, Jaymac Engineering Ltd, Tri Electric Pvt Ltd, and Zhejiang Special Vehicle Sales Co Ltd are some of the leading companies operating in the Asia Pacific low-speed electric vehicle market.
Asia Pacific Low-Speed Electric Vehicle Market Strategic Insights
Get more information on this report
Asia Pacific Low-Speed Electric Vehicle Market Segmentation Analysis
Asia Pacific Low-Speed Electric Vehicle Market Report Highlights
Asia Pacific Low-Speed Electric Vehicle Report Scope
Report Attribute
Details
Market size in 2022
US$ 1,670.98 Million
Market Size by 2030
US$ 2,823.95 Million
CAGR (2022 - 2030)
6.8%
Historical Data
2020-2021
Forecast period
2023-2030
Segments Covered
By Product
Passenger Vehicle
Utility Vehicle
By End User
Golf Courses
Hotels & Resorts
Airports
Residential & Commercial
Premises
By Vehicle Type
Golf Carts
Commercial Turf Utility Vehicles
Industrial Utility Vehicles
Personal Mobility Vehicles
Regions and Countries Covered
Asia-Pacific
China, India, Japan, Australia, Rest of Asia-Pacific
Market leaders and key company profiles
Evfarm India Pvt Ltd
Autopower Drives (India) Ltd
Navya SA
Taizhou EBU Industry & Trade Co Ltd
Yamaha Motor Co Ltd
Anhui Airuite New Energy Special Purpose Vehicle Co Ltd
Guangdong Lvtong New Energy Electric Vehicle Technology Co Ltd
Yamaha Golf-Car Co
XunHu
Xiamen Dalle Electric Car Co Ltd
Tomberlin
BOLDLY Inc
Nandan GSE Pvt Ltd
Renault SA
Deere & Co
Get more information on this report
Asia Pacific Low-Speed Electric Vehicle Market Country and Regional Insights
Get more information on this report
Identical Market Reports with other Region/Countries
The List of Companies - Asia Pacific Low-Speed Electric Vehicle Market
1. Evfarm India Pvt Ltd 2. Autopower Drives (India) Ltd 3. Navya SA4. Taizhou EBU Industry & Trade Co Ltd5. Yamaha Motor Co Ltd6. Anhui Airuite New Energy Special Purpose Vehicle Co Ltd7. Guangdong Lvtong New Energy Electric Vehicle Technology Co Ltd8. Yamaha Golf-Car Co9. XunHu10. Xiamen Dalle Electric Car Co Ltd11. Tomberlin12. BOLDLY Inc13. Nandan GSE Pvt Ltd14. Renault SA15. Deere & Co16. Suzhou Eagle Electric Vehicle Manufacturing Co Ltd17. Saera Electric Auto Ltd18. Shenzhen Aoxiang Industrial Development Co Ltd19. Cengocar20. Guangzhou Langqing Electric Car Co Ltd21. HDK Electric Vehicle Corp22. Lohr SA23. Parmaker Holdings Pty Ltd24. Prevalence Green Solutions Pvt Ltd25. Roots Industries India Ltd26. Kinghike Vehicle Co Ltd27. Lawat Motors LLP28. Marshell Green Power29. Polaris Inc30. EasyMile SAS31. Vayve Mobility Pvt Ltd32. Electric Railway (Thailand) PCL33. Kinetic Green Energy & Power Solutions Ltd34. Jaymac Engineering Ltd35. Tri Electric Pvt Ltd36. Zhejiang Special Vehicle Sales Co Ltd
Frequently Asked Questions
How big is the Asia Pacific Low-Speed Electric Vehicle Market?
The Asia Pacific Low-Speed Electric Vehicle Market is valued at US$ 1,670.98 Million in 2022, it is projected to reach US$ 2,823.95 Million by 2030.
What is the CAGR for Asia Pacific Low-Speed Electric Vehicle Market by (2022 - 2030)?
As per our report Asia Pacific Low-Speed Electric Vehicle Market, the market size is valued at US$ 1,670.98 Million in 2022, projecting it to reach US$ 2,823.95 Million by 2030. This translates to a CAGR of approximately 6.8% during the forecast period.
What segments are covered in this report?
The Asia Pacific Low-Speed Electric Vehicle Market report typically cover these key segments-
Product (Passenger Vehicle, Utility Vehicle)
End User (Golf Courses, Hotels & Resorts, Airports, Residential & Commercial, Premises)
Vehicle Type (Golf Carts, Commercial Turf Utility Vehicles, Industrial Utility Vehicles, Personal Mobility Vehicles)
What is the historic period, base year, and forecast period taken for Asia Pacific Low-Speed Electric Vehicle Market?
The historic period, base year, and forecast period can vary slightly depending on the specific market research report. However, for the Asia Pacific Low-Speed Electric Vehicle Market report:
Historic Period : 2020-2021
Base Year : 2022
Forecast Period : 2023-2030
Who are the major players in Asia Pacific Low-Speed Electric Vehicle Market?
The Asia Pacific Low-Speed Electric Vehicle Market is populated by several key players, each contributing to its growth and innovation. Some of the major players include:
Evfarm India Pvt Ltd
Autopower Drives (India) Ltd
Navya SA
Taizhou EBU Industry & Trade Co Ltd
Yamaha Motor Co Ltd
Anhui Airuite New Energy Special Purpose Vehicle Co Ltd
Guangdong Lvtong New Energy Electric Vehicle Technology Co Ltd
Yamaha Golf-Car Co
XunHu
Xiamen Dalle Electric Car Co Ltd
Tomberlin
BOLDLY Inc
Nandan GSE Pvt Ltd
Renault SA
Deere & Co
Suzhou Eagle Electric Vehicle Manufacturing Co Ltd
Saera Electric Auto Ltd
Shenzhen Aoxiang Industrial Development Co Ltd
Cengocar
Guangzhou Langqing Electric Car Co Ltd
HDK Electric Vehicle Corp
Lohr SA
Parmaker Holdings Pty Ltd
Prevalence Green Solutions Pvt Ltd
Roots Industries India Ltd
Kinghike Vehicle Co Ltd
Lawat Motors LLP
Marshell Green Power
Polaris Inc
EasyMile SAS
Vayve Mobility Pvt Ltd
Electric Railway (Thailand) PCL
Kinetic Green Energy & Power Solutions Ltd
Jaymac Engineering Ltd
Tri Electric Pvt Ltd
Zhejiang Special Vehicle Sales Co Ltd
Who should buy this report?
The Asia Pacific Low-Speed Electric Vehicle Market report is valuable for diverse stakeholders, including:
Investors: Provides insights for investment decisions pertaining to market growth, companies, or industry insights. Helps assess market attractiveness and potential returns.
Industry Players: Offers competitive intelligence, market sizing, and trend analysis to inform strategic planning, product development, and sales strategies.
Suppliers and Manufacturers: Helps understand market demand for components, materials, and services related to concerned industry.
Researchers and Consultants: Provides data and analysis for academic research, consulting projects, and market studies.
Financial Institutions: Helps assess risks and opportunities associated with financing or investing in the concerned market.
Essentially, anyone involved in or considering involvement in the Asia Pacific Low-Speed Electric Vehicle Market value chain can benefit from the information contained in a comprehensive market report.


 Get Free Sample For Asia Pacific Low-Speed Electric Vehicle Market


