Analysis - by Type (Forklifts, Aisle Trucks, Tow Tractors, Container Handlers, and Others), Drive Type (Internal Combustion Engine, Battery-Operated, and Gas-Powered), Level of Autonomy (Non/Semi-autonomous and Autonomous), and Application (Manufacturing, Warehousing, and Others)
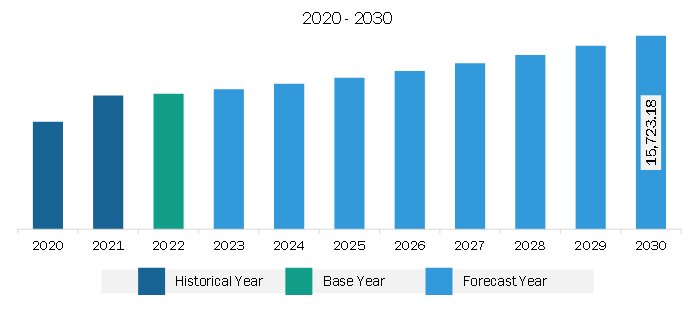
The North America industrial vehicles market was valued at US$ 11,001.3 million in 2022 and is expected to reach US$ 15,723.2 million by 2030; it is estimated to register at a CAGR of 4.6% from 2022 to 2030.
Increasing Smart Manufacturing Factories Fuels North America Industrial Vehicles Market
The ongoing digital transformation of production processes and business models in industrial companies presents a significant growth trend for the industrial vehicle market in upcoming years. With the increasing interconnection of machinery and equipment, along with the integration of sensors, there is a wealth of data being generated. By harnessing the power of big data and artificial intelligence, these companies can achieve greater transparency, efficiency, and cost reduction.
Smart manufacturing techniques, which encompass AI, ML, robotics, automation, and IoT, play a crucial role in creating efficient and adaptable production systems. These technologies can be applied across various industries such as automotive, warehouse, logistics, and manufacturing, enabling improvements in multiple processes. For instance, in product design, smart manufacturing techniques can facilitate more innovative and optimized designs. In production planning and scheduling, these technologies can enhance efficiency by optimizing resource allocation and reducing downtime. Quality control can be improved through real-time monitoring and predictive analytics, minimizing defects and ensuring higher product standards. Additionally, supply chain management can be streamlined through enhanced visibility and coordination.
By adopting smart manufacturing techniques, industrial companies can unlock new growth opportunities. The increased efficiency and productivity resulting from these technologies can lead to cost savings and improved competitiveness. Moreover, the ability to leverage data-driven insights enables companies to make more informed decisions, identify optimization opportunities, and respond quickly to market demands. As a result, the industrial vehicle market can benefit from this growth trajectory, as the demand for vehicles used in various industrial processes, such as material handling, transportation, and logistics, is likely to increase over the forecast period. This presents a promising outlook for the industrial vehicle market as it aligns with the evolving needs of digitally transformed industries.
North America Industrial Vehicles Market Overview
The rising demand for the material handling equipment and vehicles around the globe across the manufacturing sector drives the North America industrial vehicles market growth. According to the World Industrial Vehicle Statistics Association (WITS), more than 2.34 million material-handling vehicles and equipment sales were recorded during 2021. The material handling industry saw a 43.0% increase in orders in 2021 compared to the previous year, 2020. Among the 2.34 million material handling units, around 68.8%, that is 1.61 million units, were recorded as electric-powered forklifts. Electric forklift demand is increasing at a rapid pace with a surge in consumer popularity. With a surge in the number of orders, the demand for industrial vehicles such as forklifts, aisle trucks, and pallet trucks has increased.
Further, the North American North America industrial vehicles market growth is attributed to the expansion of logistics & transportation, and e-commerce industries. Online shopping in the US has increased in recent years. Total US e-commerce sales hit US$ 1.03 trillion in 2022, an increase from US$ 518.5 billion in 2018. Many logistics giants in the market, such as UPS, FedEx, USPS, XPO Logistics, and Amazon, recognized the increasing demand for industrial vehicles in their warehouses. These companies have made significant investments in warehouse establishment and in automating their logistics operations. For instance, in November 2023, United Parcel Service opened the largest warehouse in Louisville, Kentucky, with an area of around 20 acres. This warehouse is made for storage and package handling, with a significant investment of US$ 79 million for the establishment of over 3,000 automated robots and industrial vehicles. These robots and industrial vehicles will handle several warehouse tasks, such as lifting and transportation of goods from one place to another, by reducing the requirement of manual labor. Rising such investments have created massive opportunities for industrial vehicles in North America.
North America Industrial Vehicles Market Revenue and Forecast to 2030 (US$ Million)
North America Industrial Vehicles Market Segmentation
The North America industrial vehicles market is segmented based on type, drive type, level of autonomy, application, and country.
Based on type, the North America industrial vehicles market is segmented into forklifts, aisle trucks, tow tractors, container handlers, and others. The forklifts segment held the largest share in 2022.
In terms of drive type, the North America industrial vehicles market is segmented into internal combustion engine, battery-operated, and gas-powered. The battery-operated segment held the largest share in 2022.
By level of autonomy, the North America industrial vehicles market is bifurcated into non/semi-autonomous and autonomous. The non/semi-autonomous segment held a larger share in 2022.
Based on application, the North America industrial vehicles market is segmented into manufacturing, warehousing, and others. The manufacturing segment held the largest share in 2022.
Based on country, the North America industrial vehicles market is categorized into the US, Canada, and Mexico. The US dominated the North America industrial vehicles market in 2022.
Kion Group AG, Toyota Industries Corp, Mitsubishi Heavy Industries Ltd, Komatsu Ltd, Hyster-Yale Materials Handling Inc, Jungheinrich AG, CLARK Material Handling Co, Crown Equipment Corp, Konecranes Plc, and Anhui Heli Co Ltd are some of the leading companies operating in the North America industrial vehicles market.
North America Industrial Vehicles Market Strategic Insights
Get more information on this report
North America Industrial Vehicles Market Segmentation Analysis
North America Industrial Vehicles Market Report Highlights
North America Industrial Vehicles Report Scope
Report Attribute
Details
Market size in 2022
US$ 11,001.3 Million
Market Size by 2030
US$ 15,723.2 Million
CAGR (2022 - 2030)
4.6%
Historical Data
2020-2021
Forecast period
2023-2030
Segments Covered
By Type
Forklifts
Aisle Trucks
Tow Tractors
Container Handlers
By Drive Type
Internal Combustion Engine
Battery-Operated
Gas-Powered
By Application
Manufacturing
Warehousing
Regions and Countries Covered
North America
US, Canada, Mexico
Market leaders and key company profiles
Kion Group AG
Toyota Industries Corp
Mitsubishi Heavy Industries Ltd
Komatsu Ltd
Hyster-Yale Materials Handling Inc
Jungheinrich AG
CLARK Material Handling Co
Crown Equipment Corp
Konecranes Plc
Anhui Heli Co Ltd
Get more information on this report
North America Industrial Vehicles Market Country and Regional Insights
Get more information on this report
Identical Market Reports with other Region/Countries
The List of Companies - North America Industrial Vehicles Market
1. Kion Group AG2. Toyota Industries Corp3. Mitsubishi Heavy Industries Ltd4. Komatsu Ltd5. Hyster-Yale Materials Handling Inc6. Jungheinrich AG7. CLARK Material Handling Co8. Crown Equipment Corp9. Konecranes Plc10. Anhui Heli Co Ltd
Frequently Asked Questions
How big is the North America Industrial Vehicles Market?
The North America Industrial Vehicles Market is valued at US$ 11,001.3 Million in 2022, it is projected to reach US$ 15,723.2 Million by 2030.
What is the CAGR for North America Industrial Vehicles Market by (2022 - 2030)?
As per our report North America Industrial Vehicles Market, the market size is valued at US$ 11,001.3 Million in 2022, projecting it to reach US$ 15,723.2 Million by 2030. This translates to a CAGR of approximately 4.6% during the forecast period.
What segments are covered in this report?
The North America Industrial Vehicles Market report typically cover these key segments-
Type (Forklifts, Aisle Trucks, Tow Tractors, Container Handlers)
Drive Type (Internal Combustion Engine, Battery-Operated, Gas-Powered)
Application (Manufacturing, Warehousing)
What is the historic period, base year, and forecast period taken for North America Industrial Vehicles Market?
The historic period, base year, and forecast period can vary slightly depending on the specific market research report. However, for the North America Industrial Vehicles Market report:
Historic Period : 2020-2021
Base Year : 2022
Forecast Period : 2023-2030
Who are the major players in North America Industrial Vehicles Market?
The North America Industrial Vehicles Market is populated by several key players, each contributing to its growth and innovation. Some of the major players include:
Kion Group AG
Toyota Industries Corp
Mitsubishi Heavy Industries Ltd
Komatsu Ltd
Hyster-Yale Materials Handling Inc
Jungheinrich AG
CLARK Material Handling Co
Crown Equipment Corp
Konecranes Plc
Anhui Heli Co Ltd
Who should buy this report?
The North America Industrial Vehicles Market report is valuable for diverse stakeholders, including:
Investors: Provides insights for investment decisions pertaining to market growth, companies, or industry insights. Helps assess market attractiveness and potential returns.
Industry Players: Offers competitive intelligence, market sizing, and trend analysis to inform strategic planning, product development, and sales strategies.
Suppliers and Manufacturers: Helps understand market demand for components, materials, and services related to concerned industry.
Researchers and Consultants: Provides data and analysis for academic research, consulting projects, and market studies.
Financial Institutions: Helps assess risks and opportunities associated with financing or investing in the concerned market.
Essentially, anyone involved in or considering involvement in the North America Industrial Vehicles Market value chain can benefit from the information contained in a comprehensive market report.


 Get Free Sample For North America Industrial Vehicles Market


