Analysis - by Component (Solution and Services), Deployment (On-Premise and Cloud-Based), Organization Size (SMEs and Large Enterprises), and Vertical (BFSI, Hospitality, Telecom, Utilities, and Others)
No. of Pages:100
Report Code:
BMIRE00030429
Category:
Technology, Media and Telecommunications
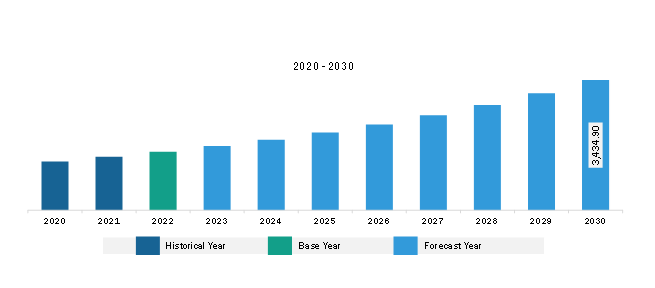
The Europe revenue assurance market was valued at US$ 1,541.74 million in 2022 and is expected to reach US$ 3,434.90 million by 2030; it is estimated to record a CAGR of 10.5% from 2022 to 2030.
Rise in Internet Penetration Drives Europe Revenue Assurance Market
As internet usage continues to grow, more businesses are conducting their operations online, leading to an increase in the generation of digital transactions and revenue streams. According to World Bank data, globally, the number of individuals using the Internet in 2021 was 63%, an increase from 60% in 2020. With more people accessing the Internet, more digital transactions are taking place. This includes online purchases, digital payments, and other online financial activities. The larger the volume of transactions, the greater the need for effective revenue assurance measures to ensure accurate billing, prevent revenue leakages, and detect fraudulent activities. Moreover, the rise in internet penetration has fueled the growth of the e-commerce industry. Online retail platforms and marketplaces are experiencing increased activity, with more businesses and consumers participating in online buying and selling. Revenue assurance is crucial in ensuring accurate revenue recognition, managing inventory, and preventing revenue leakages in e-commerce. There is a significant increase in the use of mobile internet. As more people access the Internet through their mobile devices, there is a need for revenue assurance solutions that can effectively monitor and manage revenue streams from mobile services, such as mobile data, voice calls, and value-added services. Hence, the rising internet penetration is a significant driver for the revenue assurance market.
Europe Revenue Assurance Market Overview
The Europe revenue assurance market is segmented into Germany, France, Italy, the UK, Russia, and the Rest of Europe. The Rest of Europe market is further segmented into Spain, Switzerland, the Netherlands, and Denmark. These countries are technologically advanced, and the governments of the countries mentioned above continuously invest substantial amounts in adopting robust and enhanced technologies. The revenue assurance market is experiencing significant growth in Europe, driven by factors such as rising instances of revenue leakage. Increased complexity in business models and service offerings, coupled with evolving technologies, creates more opportunities for revenue to slip through the cracks. Companies are recognizing the need for robust assurance solutions. Further, the UK businesses estimate that 5.87% of revenues remain uncollected each year, equating to US$ 263 billion in annual losses.
Several companies in Europe are engaged in strategies for the implementation of revenue assurance services. For instance, in May 2021, Global Message Services (GMS), an international messaging service provider and one of the pioneers in A2P, P2P, and P2A messaging and monetization, inked a partnership with leading telecom security solutions provider Cellusys to offer the highest degree of A2P revenue assurance through comprehensive SMS security and control. The integrated solution with onboard analytics improves the quality of service and protects mobile network operators against SMS fraud and revenue leakage in messaging.
An increase in telecommunication activity in Europe can potentially offer significant benefits to the revenue assurance market. With more users subscribing to diverse services such as 5G, IoT, cloud computing, and advanced data packages, telecom operators grapple with intricate billing systems and contracts.
This complexity creates more opportunities for errors and revenue leakage, hence requiring robust revenue assurance solutions. Moreover, emerging technologies such as artificial intelligence (AI) and machine learning (ML) can automate time-consuming tasks and provide real-time insights into potential revenue leaks. This improves the efficiency and effectiveness of revenue assurance practices. Thus, owing to the above factors, such as the rise in revenue leakage, the rising implementation of revenue assurance, and the increasing telecom industry, the revenue assurance market in Europe is propelling.
Europe Revenue Assurance Market Revenue and Forecast to 2030 (US$ Million)
Europe Revenue Assurance Market Segmentation
The Europe revenue assurance market is categorized into components, deployment, organization size, vertical, and country.
Based on component, the Europe revenue assurance market is bifurcated into solution and services. The solution segment held a larger market share in 2022.
Based on deployment, the Europe revenue assurance market is bifurcated into on-premises and cloud-based. The cloud-based segment held a larger market share in 2022.
Based on organization size, the Europe revenue assurance market is bifurcated into SMEs and large enterprises. The large enterprises segment held a larger market share in 2022.
Based on vertical, the Europe revenue assurance market is categorized into BFSI, hospitality, telecom, utilities, and others. The telecom segment held the largest market share in 2022.
By country, the Europe revenue assurance market is segmented into the Germany, France, Italy, the UK, Russia, and the Rest of Europe. The UK dominated the Europe revenue assurance market share in 2022.
Cartesian Inc, Nokia Corp, Tata Consultancy Services Ltd, Amdocs, Subex Ltd, LATRO Services Inc, Araxxe SAS, Panamax Inc, and Adapt IT Holdings Proprietary Ltd are some of the leading companies operating in the Europe revenue assurance market.
Europe Revenue Assurance Market Strategic Insights
Get more information on this report
Europe Revenue Assurance Market Segmentation Analysis
Europe Revenue Assurance Market Report Highlights
Europe Revenue Assurance Report Scope
Report Attribute
Details
Market size in 2022
US$ 1,541.74 Million
Market Size by 2030
US$ 3,434.90 Million
CAGR (2022 - 2030)
10.5%
Historical Data
2020-2021
Forecast period
2023-2030
Segments Covered
By Component
Solution
Services
By Deployment
On-Premise
Cloud-Based
By Vertical
BFSI
Hospitality
Telecom
Utilities
Regions and Countries Covered
Europe
UK, Germany, France, Russia, Italy, Rest of Europe
Market leaders and key company profiles
Cartesian Inc
Nokia Corp
Tata Consultancy Services Ltd
Amdocs
Subex Ltd
LATRO Services Inc
Araxxe SAS
Panamax Inc
Adapt IT Holdings Proprietary Ltd
Get more information on this report
Europe Revenue Assurance Market Country and Regional Insights
Get more information on this report
Identical Market Reports with other Region/Countries
The List of Companies - Europe Revenue Assurance Market
1. Cartesian Inc 2. Nokia Corp 3. Tata Consultancy Services Ltd 4. Amdocs 5. Subex Ltd 6. LATRO Services Inc 7. Araxxe SAS 8. Panamax Inc 9. Adapt IT Holdings Proprietary Ltd
Frequently Asked Questions
How big is the Europe Revenue Assurance Market?
The Europe Revenue Assurance Market is valued at US$ 1,541.74 Million in 2022, it is projected to reach US$ 3,434.90 Million by 2030.
What is the CAGR for Europe Revenue Assurance Market by (2022 - 2030)?
As per our report Europe Revenue Assurance Market, the market size is valued at US$ 1,541.74 Million in 2022, projecting it to reach US$ 3,434.90 Million by 2030. This translates to a CAGR of approximately 10.5% during the forecast period.
What segments are covered in this report?
The Europe Revenue Assurance Market report typically cover these key segments-
Component (Solution, Services)
Deployment (On-Premise, Cloud-Based)
Vertical (BFSI, Hospitality, Telecom, Utilities)
What is the historic period, base year, and forecast period taken for Europe Revenue Assurance Market?
The historic period, base year, and forecast period can vary slightly depending on the specific market research report. However, for the Europe Revenue Assurance Market report:
Historic Period : 2020-2021
Base Year : 2022
Forecast Period : 2023-2030
Who are the major players in Europe Revenue Assurance Market?
The Europe Revenue Assurance Market is populated by several key players, each contributing to its growth and innovation. Some of the major players include:
Cartesian Inc
Nokia Corp
Tata Consultancy Services Ltd
Amdocs
Subex Ltd
LATRO Services Inc
Araxxe SAS
Panamax Inc
Adapt IT Holdings Proprietary Ltd
Who should buy this report?
The Europe Revenue Assurance Market report is valuable for diverse stakeholders, including:
Investors: Provides insights for investment decisions pertaining to market growth, companies, or industry insights. Helps assess market attractiveness and potential returns.
Industry Players: Offers competitive intelligence, market sizing, and trend analysis to inform strategic planning, product development, and sales strategies.
Suppliers and Manufacturers: Helps understand market demand for components, materials, and services related to concerned industry.
Researchers and Consultants: Provides data and analysis for academic research, consulting projects, and market studies.
Financial Institutions: Helps assess risks and opportunities associated with financing or investing in the concerned market.
Essentially, anyone involved in or considering involvement in the Europe Revenue Assurance Market value chain can benefit from the information contained in a comprehensive market report.


 Get Free Sample For Europe Revenue Assurance Market


