توقعات سوق أتمتة العمليات الروبوتية في منطقة آسيا والمحيط الهادئ حتى عام 2030 - التحليل الإقليمي - حسب المكون [الحل والخدمة (الاستشارات والتكامل والتطوير والدعم والصيانة والتدريب)]، والنشر (في المؤسسة والسحابة)، وحجم المنظمة (المؤسسات الكبيرة و الشركات الصغيرة والمتوسطة)، وصناعة المستخدم النهائي (BFSI، التجارة الإلكترونية والتجزئة، الرعاية الصحية، تكنولوجيا المعلومات والاتصالات، التصنيع، وغيرها)

BMIRE00030275 | Pages: 138 | Technology, Media and Telecommunications
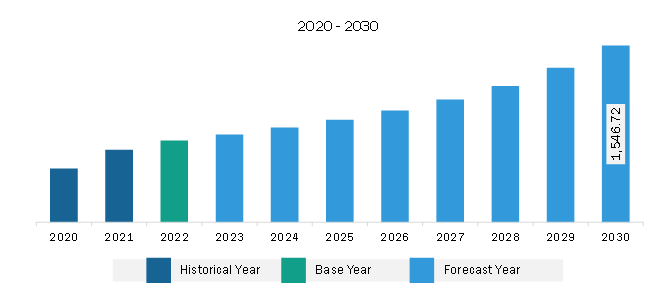
 | Jun 2024 | Type: Regional | Status: Published
بلغت قيمة سوق أتمتة العمليات الروبوتية في آسيا والمحيط الهادئ 716.88 مليون دولار أمريكي في عام 2022 ومن المتوقع أن تصل إلى 1,546.72 مليون دولار أمريكي بحلول عام 2030؛ ومن المقدر أن يتم تسجيله بمعدل نمو سنوي مركب قدره 10.1% من عام 2022 إلى عام 2030.

فوائد التكلفة التي تقدمها أتمتة العمليات الروبوتية تعزز سوق أتمتة العمليات الروبوتية في آسيا والمحيط الهادئ

توفر تقنية RPA لمستخدميها القدرة على الخدمات المُدارة داخليًا وخارجيًا بواسطة تقنية RPA، والتي تمكنهم أيضًا من استعادة التحكم في العملية دون أي تكلفة فائضة. وقد تكون التكلفة المتكبدة أقل من تكلفة العملية الخارجية بدون تقنية RPA. علاوة على ذلك، ينجذب المشترون إلى العائد القوي على الاستثمارات المقدمة من خلال عمليات نشر أتمتة العمليات الآلية.

أثبت تنفيذ أتمتة العمليات الآلية أنه يزود المشترين بقدرة معززة على التنبؤ بالتكاليف وتحسين الإدارة العامة للتكلفة، مما يسمح لهم لاحقًا بالاعتراف بفرصة نشر الموظفين في أدوار ذات قيمة أعلى واستراتيجية. علاوة على ذلك، مع تحول أتمتة العمليات الروبوتية تدريجيًا إلى الاتجاه السائد، من المتوقع أن تجد العديد من المؤسسات العميلة على مستوى العالم أنها أكثر راحة في الانتقال من مقدمي الخدمات التقليديين الحاليين إلى قدرات أتمتة العمليات الروبوتية الحديثة. هناك عامل آخر يؤثر على المشترين للاستثمار في الصفقات التي تعتمد على تقنية RPA، وهو الضغط المتزايد عليهم للحفاظ على الربحية، والقضايا التنظيمية، وإدارة التكلفة المتزايدة لنقل الأعمال إلى الخارج. وبالتالي، فإن جميع فوائد التكلفة المذكورة أعلاه لأتمتة العمليات الروبوتية تغذي نمو سوق أتمتة العمليات الروبوتية في منطقة آسيا والمحيط الهادئ. نظرة عامة على سوق أتمتة العمليات الروبوتية في منطقة آسيا والمحيط الهادئ ساهمت منطقة آسيا والمحيط الهادئ بشكل كبير في اعتماد واستخدام أتمتة العمليات الروبوتية في السنوات الأخيرة. اكتسبت أتمتة العمليات الروبوتية اهتمامًا كبيرًا عبر مختلف الصناعات في المنطقة. يمكن أن يُعزى نمو أتمتة العمليات الآلية في منطقة آسيا والمحيط الهادئ إلى الطلب المتزايد على الكفاءة وخفض التكاليف في العمليات التجارية. وقد اعترفت المنظمات في دول مثل الصين واليابان والهند وأستراليا بإمكانيات أتمتة العمليات الآلية في تبسيط العمليات وتعزيز الإنتاجية. ونتيجة لذلك، كانت هناك زيادة ملحوظة في تنفيذ أتمتة العمليات الروبوتية في قطاعات مثل الخدمات المصرفية والمالية والتصنيع والرعاية الصحية والخدمات اللوجستية.

تستفيد منطقة آسيا والمحيط الهادئ أيضًا من التقدم في تقنيات الذكاء الاصطناعي (AI) والتعلم الآلي (ML)، والتي تعد جزءًا لا يتجزأ من أتمتة العمليات الآلية. تمكن هذه التقنيات الروبوتات من التعلم والتكيف مع الظروف المتغيرة، مما يجعلها أكثر ذكاءً وقدرة على التعامل مع المهام المعقدة. لقد أسس بائعو أتمتة العمليات الروبوتية العالميون والإقليميون حضورًا قويًا في منطقة آسيا والمحيط الهادئ. قامت شركات مثل UiPath وAutomation Anywhere وBlue Prism بتوسيع عملياتها وشكلت شراكات استراتيجية مع المؤسسات المحلية لتلبية الطلب المتزايد على حلول أتمتة العمليات الآلية.

إيرادات سوق أتمتة العمليات الروبوتية في آسيا والمحيط الهادئ والتوقعات حتى عام 2030 (مليون دولار أمريكي)

تجزئة سوق أتمتة العمليات الروبوتية في آسيا والمحيط الهادئ

سوق أتمتة العمليات الروبوتية في آسيا والمحيط الهادئ مجزأ استنادًا إلى المكون والنشر وحجم المؤسسة وصناعة المستخدم النهائي والبلد.

استنادًا إلى المكونات، ينقسم سوق أتمتة العمليات الروبوتية في منطقة آسيا والمحيط الهادئ إلى حلول وخدمات. استحوذ قطاع الخدمات على حصة أكبر في عام 2022. ويتم تصنيف قطاع الخدمات فرعيًا إلى الاستشارات والتكامل والتطوير والدعم والصيانة والتدريب.

فيما يتعلق بالنشر، ينقسم سوق أتمتة العمليات الروبوتية في آسيا والمحيط الهادئ إلى محلي وسحابي. استحوذ القطاع الداخلي على حصة أكبر في عام 2022.

استنادًا إلى حجم المؤسسة، ينقسم سوق أتمتة العمليات الروبوتية في منطقة آسيا والمحيط الهادئ إلى شركات صغيرة ومتوسطة ومؤسسات كبيرة. استحوذ قطاع المؤسسات الكبيرة على حصة أكبر في عام 2022.

بحسب صناعة المستخدم النهائي، يتم تقسيم سوق أتمتة العمليات الروبوتية في آسيا والمحيط الهادئ إلى BFSI، والتجارة الإلكترونية والتجزئة، والرعاية الصحية، وتكنولوجيا المعلومات والاتصالات، والتصنيع، و آحرون. استحوذ قطاع BFSI على الحصة الأكبر في عام 2022. بناءً على البلد، يتم تصنيف سوق أتمتة العمليات الروبوتية في آسيا والمحيط الهادئ إلى أستراليا والصين والهند واليابان وكوريا الجنوبية وبقية دول آسيا والمحيط الهادئ. سيطرت اليابان على سوق أتمتة العمليات الروبوتية في منطقة آسيا والمحيط الهادئ في عام 2022.

Appian Corp، وAutomation Anywhere Inc، وBlue Prism Ltd، وCyclone Robotics، وDatamatics Global Services Ltd، وInternational Business Machines Corp، وMicrosoft Corp، وNICE Ltd، وPegasystems Inc. تعد شركة Salesforce Inc وSAP SE وUiPath Inc من الشركات الرائدة العاملة في سوق أتمتة العمليات الآلية في منطقة آسيا والمحيط الهادئ.

Table of Content


1. Introduction

1.1 The Insight Partners Research Report Guidance

1.2 Segmentation

2. Executive Summary

2.1 Key Insights

2.2 Market Attractiveness

3. Research Methodology

3.1 Coverage

3.2 Secondary Research

3.3 Primary Research

4. Asia Pacific Robotic Process Automation Market Landscape

4.1 Overview

4.2 Value Chain Analysis

4.3 Ecosystem Analysis

5. Asia Pacific Robotic Process Automation Market - Key Market Dynamics

5.1 Asia Pacific Robotic Process Automation Market - Key Market Dynamics

5.2 Market Drivers

5.2.1 Increased Demand for Robotic Process Automation in BPO

5.2.2 Cost Benefits Offered by Robotic Process Automation

5.2.3 Rise in Use of Robotic Process Automation in BFSI Sector

5.3 Market Restraints

5.3.1 Frequent Alterations in Operating Procedures and Business Rules Impacting Robotic Process Automation Efficiency

5.3.2 Lack of Prospects in Small and Medium Businesses (SMBs)

5.4 Market Opportunities

5.4.1 Rising Demand for Cognitive Robotic Process Automation

5.4.2 Increasing Adoption of Robotic Process Automation in Retail Sector

5.5 Future Trends

5.5.1 Growing Technological Advancements

5.6 Impact of Drivers and Restraints:

6. Robotic Process Automation Market - Asia Pacific Market Analysis

6.1 Asia Pacific Robotic Process Automation Market Revenue (US$ Million), 2022 - 2030

6.2 Asia Pacific Robotic Process Automation Market Forecast and Analysis

7. Asia Pacific Robotic Process Automation Market Analysis - Component

7.1 Solution

7.1.1 Overview

7.1.2 Solution Market, Revenue and Forecast to 2030 (US$ Million)

7.2 Service

7.2.1 Overview

7.2.2 Service Market, Revenue and Forecast to 2030 (US$ Million)

7.2.3 Asia Pacific Robotic Process Automation Market, By Service

7.2.4 Consulting

7.2.4.1 Overview

7.2.4.2 Consulting Market, Revenue and Forecast to 2030 (US$ Million)

7.2.5 Integration & Development

7.2.5.1 Overview

7.2.5.2 Integration & Development Market, Revenue and Forecast to 2030 (US$ Million)

7.2.6 Support & Maintenance

7.2.6.1 Overview

7.2.6.2 Support & Maintenance Market, Revenue and Forecast to 2030 (US$ Million)

7.2.7 Training

7.2.7.1 Overview

7.2.7.2 Training Market, Revenue and Forecast to 2030 (US$ Million)

8. Asia Pacific Robotic Process Automation Market Analysis - Deployment

8.1 On-Premise

8.1.1 Overview

8.1.2 On-Premise Market, Revenue and Forecast to 2030 (US$ Million)

8.2 Cloud

8.2.1 Overview

8.2.2 Cloud Market, Revenue and Forecast to 2030 (US$ Million)

9. Asia Pacific Robotic Process Automation Market Analysis - Organization Size

9.1 Large Enterprises

9.1.1 Overview

9.1.2 Large Enterprises Market, Revenue and Forecast to 2030 (US$ Million)

9.2 SMEs

9.2.1 Overview

9.2.2 SMEs Market, Revenue and Forecast to 2030 (US$ Million)

10. Asia Pacific Robotic Process Automation Market Analysis - End-User Industry

10.1 BFSI

10.1.1 Overview

10.1.2 BFSI Market, Revenue and Forecast to 2030 (US$ Million)

10.2 e-Commerce & Retail

10.2.1 Overview

10.2.2 e-Commerce & Retail Market, Revenue and Forecast to 2030 (US$ Million)

10.3 Healthcare

10.3.1 Overview

10.3.2 Healthcare Market, Revenue and Forecast to 2030 (US$ Million)

10.4 IT & Telecom

10.4.1 Overview

10.4.2 IT & Telecom Market, Revenue and Forecast to 2030 (US$ Million)

10.5 Manufacturing

10.5.1 Overview

10.5.2 Manufacturing Market, Revenue and Forecast to 2030 (US$ Million)

10.6 Others

10.6.1 Overview

10.6.2 Others Market, Revenue and Forecast to 2030 (US$ Million)

11. Asia Pacific Robotic Process Automation Market - Analysis

11.1 Asia Pacific

11.1.1 Asia Pacific Robotic Process Automation Market Overview

11.1.2 Asia Pacific Robotic Process Automation Market Revenue and Forecasts and Analysis - By Country

11.1.2.1 Asia Pacific Robotic Process Automation Market Revenue and Forecasts and Analysis - By Country

11.1.2.2 Australia Robotic Process Automation Market Revenue and Forecasts to 2030 (US$ Mn)

11.1.2.2.1 Australia Robotic Process Automation Market Breakdown, by Component

11.1.2.2.1.1 Australia Robotic Process Automation Market Breakdown, by Service

11.1.2.2.2 Australia Robotic Process Automation Market Breakdown, by Deployment

11.1.2.2.3 Australia Robotic Process Automation Market Breakdown, by Organization Size

11.1.2.2.4 Australia Robotic Process Automation Market Breakdown, by End-User Industry

11.1.2.3 China Robotic Process Automation Market Revenue and Forecasts to 2030 (US$ Mn)

11.1.2.3.1 China Robotic Process Automation Market Breakdown, by Component

11.1.2.3.1.1 China Robotic Process Automation Market Breakdown, by Service

11.1.2.3.2 China Robotic Process Automation Market Breakdown, by Deployment

11.1.2.3.3 China Robotic Process Automation Market Breakdown, by Organization Size

11.1.2.3.4 China Robotic Process Automation Market Breakdown, by End-User Industry

11.1.2.4 India Robotic Process Automation Market Revenue and Forecasts to 2030 (US$ Mn)

11.1.2.4.1 India Robotic Process Automation Market Breakdown, by Component

11.1.2.4.1.1 India Robotic Process Automation Market Breakdown, by Service

11.1.2.4.2 India Robotic Process Automation Market Breakdown, by Deployment

11.1.2.4.3 India Robotic Process Automation Market Breakdown, by Organization Size

11.1.2.4.4 India Robotic Process Automation Market Breakdown, by End-User Industry

11.1.2.5 Japan Robotic Process Automation Market Revenue and Forecasts to 2030 (US$ Mn)

11.1.2.5.1 Japan Robotic Process Automation Market Breakdown, by Component

11.1.2.5.1.1 Japan Robotic Process Automation Market Breakdown, by Service

11.1.2.5.2 Japan Robotic Process Automation Market Breakdown, by Deployment

11.1.2.5.3 Japan Robotic Process Automation Market Breakdown, by Organization Size

11.1.2.5.4 Japan Robotic Process Automation Market Breakdown, by End-User Industry

11.1.2.6 South Korea Robotic Process Automation Market Revenue and Forecasts to 2030 (US$ Mn)

11.1.2.6.1 South Korea Robotic Process Automation Market Breakdown, by Component

11.1.2.6.1.1 South Korea Robotic Process Automation Market Breakdown, by Service

11.1.2.6.2 South Korea Robotic Process Automation Market Breakdown, by Deployment

11.1.2.6.3 South Korea Robotic Process Automation Market Breakdown, by Organization Size

11.1.2.6.4 South Korea Robotic Process Automation Market Breakdown, by End-User Industry

11.1.2.7 Rest of Asia Pacific Robotic Process Automation Market Revenue and Forecasts to 2030 (US$ Mn)

11.1.2.7.1 Rest of Asia Pacific Robotic Process Automation Market Breakdown, by Component

11.1.2.7.1.1 Rest of Asia Pacific Robotic Process Automation Market Breakdown, by Service

11.1.2.7.2 Rest of Asia Pacific Robotic Process Automation Market Breakdown, by Deployment

11.1.2.7.3 Rest of Asia Pacific Robotic Process Automation Market Breakdown, by Organization Size

11.1.2.7.4 Rest of Asia Pacific Robotic Process Automation Market Breakdown, by End-User Industry

12. Industry Landscape

12.1 Overview

12.2 Market Initiative

12.3 Product News & Company News

12.4 Collaboration and Mergers & Acquisitions

13. Company Profiles

13.1 Appian Corp

13.1.1 Key Facts

13.1.2 Business Description

13.1.3 Products and Services

13.1.4 Financial Overview

13.1.5 SWOT Analysis

13.1.6 Key Developments

13.2 Automation Anywhere Inc

13.2.1 Key Facts

13.2.2 Business Description

13.2.3 Products and Services

13.2.4 Financial Overview

13.2.5 SWOT Analysis

13.2.6 Key Developments

13.3 Blue Prism Ltd

13.3.1 Key Facts

13.3.2 Business Description

13.3.3 Products and Services

13.3.4 Financial Overview

13.3.5 SWOT Analysis

13.3.6 Key Developments

13.4 Cyclone Robotics

13.4.1 Key Facts

13.4.2 Business Description

13.4.3 Products and Services

13.4.4 Financial Overview

13.4.5 SWOT Analysis

13.4.6 Key Developments

13.5 Datamatics Global Services Ltd

13.5.1 Key Facts

13.5.2 Business Description

13.5.3 Products and Services

13.5.4 Financial Overview

13.5.5 SWOT Analysis

13.5.6 Key Developments

13.6 International Business Machines Corp

13.6.1 Key Facts

13.6.2 Business Description

13.6.3 Products and Services

13.6.4 Financial Overview

13.6.5 SWOT Analysis

13.6.6 Key Developments

13.7 Microsoft Corp

13.7.1 Key Facts

13.7.2 Business Description

13.7.3 Products and Services

13.7.4 Financial Overview

13.7.5 SWOT Analysis

13.7.6 Key Developments

13.8 NICE Ltd

13.8.1 Key Facts

13.8.2 Business Description

13.8.3 Products and Services

13.8.4 Financial Overview

13.8.5 SWOT Analysis

13.8.6 Key Developments

13.9 Pegasystems Inc

13.9.1 Key Facts

13.9.2 Business Description

13.9.3 Products and Services

13.9.4 Financial Overview

13.9.5 SWOT Analysis

13.9.6 Key Developments

13.10 Salesforce Inc

13.10.1 Key Facts

13.10.2 Business Description

13.10.3 Products and Services

13.10.4 Financial Overview

13.10.5 SWOT Analysis

13.10.6 Key Developments

13.11 SAP SE

13.11.1 Key Facts

13.11.2 Business Description

13.11.3 Products and Services

13.11.4 Financial Overview

13.11.5 SWOT Analysis

13.11.6 Key Developments

13.12 UiPath Inc

13.12.1 Key Facts

13.12.2 Business Description

13.12.3 Products and Services

13.12.4 Financial Overview

13.12.5 SWOT Analysis

13.12.6 Key Developments

14. Appendix

14.1 Word Index

List of Tables

Table 1. Asia Pacific Robotic Process Automation Market Segmentation

Table 2. Asia Pacific Robotic Process Automation Market Revenue and Forecasts To 2030 (US$ Million)

Table 3. Asia Pacific Robotic Process Automation Market Revenue and Forecasts To 2030 (US$ Million) - Component

Table 4. Asia Pacific Robotic Process Automation Market Revenue and Forecasts To 2030 (US$ Million) - Service

Table 5. Asia Pacific Robotic Process Automation Market Revenue and Forecasts To 2030 (US$ Million) - Deployment

Table 6. Asia Pacific Robotic Process Automation Market Revenue and Forecasts To 2030 (US$ Million) - Organization Size

Table 7. Asia Pacific Robotic Process Automation Market Revenue and Forecasts To 2030 (US$ Million) - End-User Industry

Table 8. Asia Pacific Robotic Process Automation Market Revenue and Forecasts To 2030 (US$ Mn) - By Country

Table 9. Australia Robotic Process Automation Market Revenue and Forecasts To 2030 (US$ Mn) - By Component

Table 10. Australia Robotic Process Automation Market Revenue and Forecasts To 2030 (US$ Mn) - By Service

Table 11. Australia Robotic Process Automation Market Revenue and Forecasts To 2030 (US$ Mn) - By Deployment

Table 12. Australia Robotic Process Automation Market Revenue and Forecasts To 2030 (US$ Mn) - By Organization Size

Table 13. Australia Robotic Process Automation Market Revenue and Forecasts To 2030 (US$ Mn) - By End-User Industry

Table 14. China Robotic Process Automation Market Revenue and Forecasts To 2030 (US$ Mn) - By Component

Table 15. China Robotic Process Automation Market Revenue and Forecasts To 2030 (US$ Mn) - By Service

Table 16. China Robotic Process Automation Market Revenue and Forecasts To 2030 (US$ Mn) - By Deployment

Table 17. China Robotic Process Automation Market Revenue and Forecasts To 2030 (US$ Mn) - By Organization Size

Table 18. China Robotic Process Automation Market Revenue and Forecasts To 2030 (US$ Mn) - By End-User Industry

Table 19. India Robotic Process Automation Market Revenue and Forecasts To 2030 (US$ Mn) - By Component

Table 20. India Robotic Process Automation Market Revenue and Forecasts To 2030 (US$ Mn) - By Service

Table 21. India Robotic Process Automation Market Revenue and Forecasts To 2030 (US$ Mn) - By Deployment

Table 22. India Robotic Process Automation Market Revenue and Forecasts To 2030 (US$ Mn) - By Organization Size

Table 23. India Robotic Process Automation Market Revenue and Forecasts To 2030 (US$ Mn) - By End-User Industry

Table 24. Japan Robotic Process Automation Market Revenue and Forecasts To 2030 (US$ Mn) - By Component

Table 25. Japan Robotic Process Automation Market Revenue and Forecasts To 2030 (US$ Mn) - By Service

Table 26. Japan Robotic Process Automation Market Revenue and Forecasts To 2030 (US$ Mn) - By Deployment

Table 27. Japan Robotic Process Automation Market Revenue and Forecasts To 2030 (US$ Mn) - By Organization Size

Table 28. Japan Robotic Process Automation Market Revenue and Forecasts To 2030 (US$ Mn) - By End-User Industry

Table 29. South Korea Robotic Process Automation Market Revenue and Forecasts To 2030 (US$ Mn) - By Component

Table 30. South Korea Robotic Process Automation Market Revenue and Forecasts To 2030 (US$ Mn) - By Service

Table 31. South Korea Robotic Process Automation Market Revenue and Forecasts To 2030 (US$ Mn) - By Deployment

Table 32. South Korea Robotic Process Automation Market Revenue and Forecasts To 2030 (US$ Mn) - By Organization Size

Table 33. South Korea Robotic Process Automation Market Revenue and Forecasts To 2030 (US$ Mn) - By End-User Industry

Table 34. Rest of Asia Pacific Robotic Process Automation Market Revenue and Forecasts To 2030 (US$ Mn) - By Component

Table 35. Rest of Asia Pacific Robotic Process Automation Market Revenue and Forecasts To 2030 (US$ Mn) - By Service

Table 36. Rest of Asia Pacific Robotic Process Automation Market Revenue and Forecasts To 2030 (US$ Mn) - By Deployment

Table 37. Rest of Asia Pacific Robotic Process Automation Market Revenue and Forecasts To 2030 (US$ Mn) - By Organization Size

Table 38. Rest of Asia Pacific Robotic Process Automation Market Revenue and Forecasts To 2030 (US$ Mn) - By End-User Industry

Table 39. List of Abbreviation

?

List of Figures

Figure 1. Asia Pacific Robotic Process Automation Market Segmentation, By Country

Figure 2. Value Chain: Asia Pacific Robotic Process Automation Market

Figure 3. Ecosystem: Asia Pacific Robotic Process Automation Market

Figure 4. Impact Analysis of Drivers and Restraints

Figure 5. Asia Pacific Robotic Process Automation Market Revenue (US$ Million), 2022 - 2030

Figure 6. Asia Pacific Robotic Process Automation Market Share (%) - Component, 2022 and 2030

Figure 7. Solution Market Revenue and Forecasts To 2030 (US$ Million)

Figure 8. Service Market Revenue and Forecasts To 2030 (US$ Million)

Figure 9. Asia Pacific Robotic Process Automation Market Share (%) - Service, 2022 and 2030

Figure 10. Consulting Market Revenue and Forecasts To 2030 (US$ Million)

Figure 11. Integration & Development Market Revenue and Forecasts To 2030 (US$ Million)

Figure 12. Support & Maintenance Market Revenue and Forecasts To 2030 (US$ Million)

Figure 13. Training Market Revenue and Forecasts To 2030 (US$ Million)

Figure 14. Asia Pacific Robotic Process Automation Market Share (%) - Deployment, 2022 and 2030

Figure 15. On-Premise Market Revenue and Forecasts To 2030 (US$ Million)

Figure 16. Cloud Market Revenue and Forecasts To 2030 (US$ Million)

Figure 17. Asia Pacific Robotic Process Automation Market Share (%) - Organization Size, 2022 and 2030

Figure 18. Large Enterprises Market Revenue and Forecasts To 2030 (US$ Million)

Figure 19. SMEs Market Revenue and Forecasts To 2030 (US$ Million)

Figure 20. Asia Pacific Robotic Process Automation Market Share (%) - End-User Industry, 2022 and 2030

Figure 21. BFSI Market Revenue and Forecasts To 2030 (US$ Million)

Figure 22. e-Commerce & Retail Market Revenue and Forecasts To 2030 (US$ Million)

Figure 23. Healthcare Market Revenue and Forecasts To 2030 (US$ Million)

Figure 24. IT & Telecom Market Revenue and Forecasts To 2030 (US$ Million)

Figure 25. Manufacturing Market Revenue and Forecasts To 2030 (US$ Million)

Figure 26. Others Market Revenue and Forecasts To 2030 (US$ Million)

Figure 27. Asia Pacific Robotic Process Automation Market Breakdown, by Key Countries, 2022 (US$)

Figure 28. Asia Pacific Robotic Process Automation Market Breakdown by Key Countries, 2022 and 2030 (%)

Figure 29. Australia Robotic Process Automation Market Revenue and Forecasts To 2030 (US$ Mn)

Figure 30. China Robotic Process Automation Market Revenue and Forecasts To 2030 (US$ Mn)

Figure 31. India Robotic Process Automation Market Revenue and Forecasts To 2030 (US$ Mn)

Figure 32. Japan Robotic Process Automation Market Revenue and Forecasts To 2030 (US$ Mn)

Figure 33. South Korea Robotic Process Automation Market Revenue and Forecasts To 2030 (US$ Mn)

Figure 34. Rest of Asia Pacific Robotic Process Automation Market Revenue and Forecasts To 2030 (US$ Mn)


?

1. Appian Corp

2. Automation Anywhere Inc

3. Blue Prism Ltd

4. Cyclone Robotics

5. Datamatics Global Services Ltd

6. International Business Machines Corp

7. Microsoft Corp

8. NICE Ltd

9. Pegasystems Inc

10. Salesforce Inc

11. SAP SE

12. UiPath Inc

  • Save and reduce time carrying out entry-level research by identifying the growth, size, leading players, and segments in the Asia Pacific robotic process automation market.
  • Highlights key business priorities in order to assist companies to realign their business strategies.
  • The key findings and recommendations highlight crucial progressive industry trends in Asia Pacific robotic process automation market, thereby allowing players across the value chain to develop effective long-term strategies.
  • Develop/modify business expansion plans by using substantial growth offering developed and emerging markets.
  • Scrutinize in-depth Asia Pacific market trends and outlook coupled with the factors driving the market, as well as those hindering it.
  • Enhance the decision-making process by understanding the strategies that underpin security interest with respect to client products, segmentation, pricing, and distribution.
Report Code
Full Name
Country Name
Email Id
Phone Number
Job Title
Company
Requirement

Note : Your data will never be shared with third parties, however, we may send you information from time to time about our products that may be of interest to you. By submitting your details, you agree to be contacted by us. You may contact us at any time to opt-out.


Purchase Options
Single User License
$3550
$2840
Site License
$4550
$3640
Enterprise License
$5550
$4440