Analysis - by Type [Flotation Chemicals (Frothers, Flocculants, Depressants, Collectors, and Others), Solvent Extractants, Grinding Aids, and Others], Mineral Type (Base Metals, Non-Metallic Minerals, Precious Metals, and Others), and Application (Mineral Processing, Wastewater Treatment, and Others)
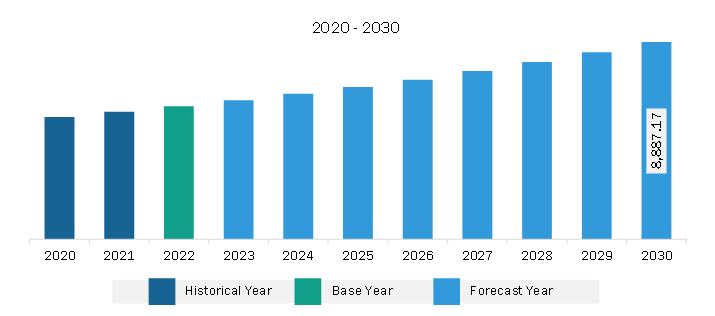
The Asia Pacific mining chemicals market was valued at US$ 6,013.78 million in 2022 and is expected to reach US$ 8,887.17 million by 2030; it is estimated to register at a CAGR of 5.0% from 2022 to 2030.
Increasing Investments and Operations in Global Mining Sector Boost Asia Pacific Mining Chemicals Market
The increase in mining activities worldwide has resulted in rising demand for mining chemicals. Further, the adoption of advanced mining technologies, such as automation and digitization, improves efficiency and environmental sustainability in mining operations globally. According to the World Bank, production of graphite, lithium, and cobalt is expected to rise by ~500% by 2050 to meet the growing demand for clean energy technologies.
The region is witnessing an increase in mining activities due to the discovery of new mineral deposits, growing infrastructure developments, and increasing demand for minerals and resources. Governments and organizations in countries such as Australia, China, the Czech Republic, Portugal, the US, Canada, and others are actively promoting exploration and mining activities. As per a report by the Green Finance and Development Centre, investments in the metals and mining industries in China reached US$ 10 billion in the first half of 2023, a rise of 131% compared to the same period in 2022. Further, in October 2023, the government of Australia invested an additional US$ 3.9 billion in the Export Finance Australia-managed Critical Minerals Facility. The funding targeted support for mining projects aligned with Australia's Critical Minerals Strategy 2023-2030. The expansion activities and rising investments in the mining sector drive the demand for mining chemicals.
Asia Pacific Mining Chemicals Market Overview
Asia Pacific marks the presence of major mining companies such as Mitsubishi Materials Corporation, Jiangxi Copper Co Ltd, Aluminum Corporation of China Ltd, Coal India Limited, China Molybdenum Co Ltd, BHP, and others. Asia Pacific has 10 major surface mining projects-Green mine (China), Sangatta mine (Indonesia), Heidaigou mine (China), Oyu Tolgoi Copper-Gold mine (Mongolia), Gevra OC mine (India), Letpadaung Copper mine (Myanmar), Li mine (Thailand), FTB Project (Thailand), and Pasir mine (Indonesia). According to the report published by the US Geological Survey in 2022, China was the largest supplier of 25 non-fuel mineral commodities to several countries globally in 2021. Additionally, China is the producer of 16 critical minerals out of 25 listed minerals. According to research conducted by the Norwegian Institute of International Affairs in 2022, Central Asia recorded a presence of 38.6% of global manganese ore reserves, 30.07% of chromium, 20% of lead, 12.6% of zinc, 8.7% of titanium, 5.8% of aluminum, and 5.3% of copper.
China, Tajikistan, Australia, Vietnam, and other countries account for major antimony mine production and reserves worldwide. As per the World Mining Data 2022 report released by the Federal Ministry Republic of Austria, the mining production rate for minerals in Australia recorded a rise of 142.2% during 2000-2020. As per the International Energy Agency, Chinese companies doubled their investments in critical mineral exploration, especially in lithium projects. The demand for mining chemicals is directly proportional to the mining operations and mineral exploration activities in the region. Therefore, growth in mining operations bolsters the demand for mining chemicals in Asia Pacific.
Asia Pacific Mining Chemicals Market Revenue and Forecast to 2030 (US$ Million)
Asia Pacific Mining Chemicals Market Segmentation
In terms of type, the Asia Pacific mining chemicals market is segmented into flotation chemicals, solvent extractants, grinding aids, and others. The flotation chemicals segment is sub-segmented into frothers, flocculants, depressants, collectors, and others. The flotation chemicals segment held the largest share in 2022.
By mineral type, the Asia Pacific mining chemicals market is segmented into base metals, non-metallic minerals, precious metals, and others. The non-metallic minerals segment held the largest share in 2022.
In terms of application, the Asia Pacific mining chemicals market is segmented into mineral processing, wastewater treatment, and others. The mineral processing segment held the largest share in 2022.
Based on country, the Asia Pacific mining chemicals market is categorized into Australia, China, India, Japan, South Korea, and the Rest of Asia Pacific. China dominated the Asia Pacific mining chemicals market in 2022.
Orica Ltd, Kemira Oyj, BASF SE, Clariant AG, Dow Inc, AECI Ltd, Nouryon Chemicals Holding BV, Solvay SA, and Arkema SA are some of the leading companies operating in the Asia Pacific mining chemicals market.
Asia Pacific Mining Chemicals Market Strategic Insights
Get more information on this report
Asia Pacific Mining Chemicals Market Segmentation Analysis
Asia Pacific Mining Chemicals Market Report Highlights
Asia Pacific Mining Chemicals Report Scope
Report Attribute
Details
Market size in 2022
US$ 6,013.78 Million
Market Size by 2030
US$ 8,887.17 Million
CAGR (2022 - 2030)
5.0%
Historical Data
2020-2021
Forecast period
2023-2030
Segments Covered
By Type
Flotation Chemicals
Solvent Extractants
Grinding Aids
By Mineral Type
Base Metals
Non-Metallic Minerals
Precious Metals
By Application
Mineral Processing
Wastewater Treatment
Regions and Countries Covered
Asia-Pacific
China, India, Japan, Australia, Rest of Asia-Pacific
Market leaders and key company profiles
Orica Ltd
Kemira Oyj
BASF SE
Clariant AG
Dow Inc
AECI Ltd
Nouryon Chemicals Holding BV
Solvay SA
Arkema SA
Get more information on this report
Asia Pacific Mining Chemicals Market Country and Regional Insights
Get more information on this report
Identical Market Reports with other Region/Countries
The List of Companies - Asia Pacific Mining Chemicals Market
1. Orica Ltd2. Kemira Oyj3. BASF SE4. Clariant AG5. Dow Inc6. AECI Ltd7. Nouryon Chemicals Holding BV8. Solvay SA9. Arkema SA
Frequently Asked Questions
How big is the Asia Pacific Mining Chemicals Market?
The Asia Pacific Mining Chemicals Market is valued at US$ 6,013.78 Million in 2022, it is projected to reach US$ 8,887.17 Million by 2030.
What is the CAGR for Asia Pacific Mining Chemicals Market by (2022 - 2030)?
As per our report Asia Pacific Mining Chemicals Market, the market size is valued at US$ 6,013.78 Million in 2022, projecting it to reach US$ 8,887.17 Million by 2030. This translates to a CAGR of approximately 5.0% during the forecast period.
What segments are covered in this report?
The Asia Pacific Mining Chemicals Market report typically cover these key segments-
Type (Flotation Chemicals, Solvent Extractants, Grinding Aids)
Mineral Type (Base Metals, Non-Metallic Minerals, Precious Metals)
What is the historic period, base year, and forecast period taken for Asia Pacific Mining Chemicals Market?
The historic period, base year, and forecast period can vary slightly depending on the specific market research report. However, for the Asia Pacific Mining Chemicals Market report:
Historic Period : 2020-2021
Base Year : 2022
Forecast Period : 2023-2030
Who are the major players in Asia Pacific Mining Chemicals Market?
The Asia Pacific Mining Chemicals Market is populated by several key players, each contributing to its growth and innovation. Some of the major players include:
Orica Ltd
Kemira Oyj
BASF SE
Clariant AG
Dow Inc
AECI Ltd
Nouryon Chemicals Holding BV
Solvay SA
Arkema SA
Who should buy this report?
The Asia Pacific Mining Chemicals Market report is valuable for diverse stakeholders, including:
Investors: Provides insights for investment decisions pertaining to market growth, companies, or industry insights. Helps assess market attractiveness and potential returns.
Industry Players: Offers competitive intelligence, market sizing, and trend analysis to inform strategic planning, product development, and sales strategies.
Suppliers and Manufacturers: Helps understand market demand for components, materials, and services related to concerned industry.
Researchers and Consultants: Provides data and analysis for academic research, consulting projects, and market studies.
Financial Institutions: Helps assess risks and opportunities associated with financing or investing in the concerned market.
Essentially, anyone involved in or considering involvement in the Asia Pacific Mining Chemicals Market value chain can benefit from the information contained in a comprehensive market report.


 Get Free Sample For Asia Pacific Mining Chemicals Market


