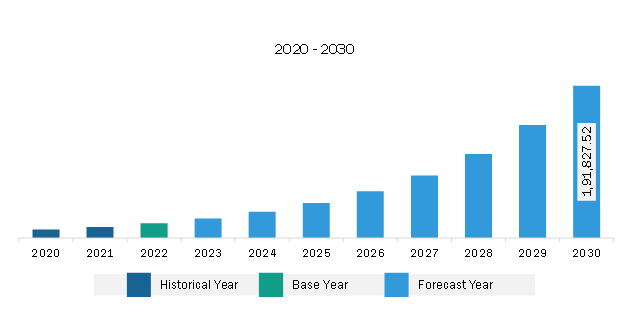
The Asia Pacific graphics processing unit (GPU) market is expected to grow from US$ 18,677.13 million in 2022 to US$ 1,91,827.52 million by 2030. It is estimated to register a CAGR of 33.8% from 2022 to 2030.
Deployment in Emerging Applications Such as AI and ML Boosts Asia Pacific Graphics Processing Unit (GPU) Market
GPUs are increasingly being used for a wide range of gaming applications, including machine learning (ML), artificial intelligence (AI), and data science. AI and ML algorithms are increasingly being used in a variety of applications, such as natural language processing, image recognition, and data mining. These algorithms require powerful GPUs to train and run. Also, these applications are becoming increasingly popular in a variety of industries such as healthcare, finance, and manufacturing.
Several companies such as NVIDIA and AMD introduce new and innovative AI technologies. Nvidia's latest earnings beat indicates a new phenomenon in the GPU industry. Technology is now at the heart of artificial intelligence boom. Nvidia is finally reaping the benefits of its early AI investment as the engine powers large language models (LLMs) such as ChatGPT. This has helped to mitigate the impact of broader semiconductor industry challenges related to US-China trade tensions and chip shortages across the world.
In August 2023, NVIDIA announced a new configuration for its advanced AI chips, which is intended to accelerate generative AI applications. According to Nvidia, the latest version of the Grace Hopper Superchip enhances the quantity of high-bandwidth memory, allowing the architecture to power larger AI models. The design is optimized for AI inference functions, which effectively power generative AI applications, including ChatGPT. In June 2023, AMD announced its most advanced GPU for AI, the MI300X. The company will start shipping it to some customers later this year. Therefore, owing to the above parameters, the deployment of emerging applications such as AI and ML is expected to offer lucrative opportunities for the GPU market in the coming years.
Asia Pacific Graphics Processing Unit (GPU) Market Overview
The gaming industry in Asia Pacific is broad. The region's 1.5 billion recognized gamers range from hyper-casual to hardcore. Gamers spend more time gaming than the world average and have the highest involvement levels. According to YouGov, Asia continues to dominate the global gaming business. China is the largest gaming market, with three out of ten (29%) Chinese customers focusing to spend the most of their weekly time gaming. Following China, Hong Kong (23%), Indonesia (19%), and Singapore (18%) all have a significant share of weekly gamers.
During the COVID-19 outbreak, India had a significant increase in gaming users, culminating in the growth of the gaming sector. The country had a smaller number of companies involved in digital gaming. However, in 2023, the number has risen to 400. This is mostly due to a significant increase in the number of gaming users, estimated at 90 million. Furthermore, the Sony PlayStation 4 system has achieved enormous popularity, accounting for the highest percentage of shipments in 2020. As a result, rise in number of gaming users has increased demand for graphics processing units in the country, propelling the GPU market growth in India.
South Korea, on the other hand, is expected to develop at a rapid rate in APAC owing to the significant presence of Samsung Electronics. The company is in charge of producing Nvidia Corp's latest gaming processors in order to strengthen its market position. In this context, Samsung's 8 nm process node will be used to produce Nvidia's new series of graphics processing units. Aside from that, the company stated that it intends to invest heavily in order to become the world's largest logic chipmaker by 2030. As a result, such corporate actions would open up new opportunities for the South Korean graphics processing unit industry. Thus, owing to the above factors, the APAC GPU market reports significant growth.
Asia Pacific Graphics Processing Unit (GPU) Market Revenue and Forecast to 2030 (US$ Million)
Asia Pacific Graphics Processing Unit (GPU) Market Segmentation
Based on type, the Asia Pacific graphics processing unit (GPU) market is segmented into dedicated, integrated, and hybrid. The integrated segment held the largest share of the Asia Pacific graphics processing unit (GPU) market in 2022.
In terms of application, the Asia Pacific graphics processing unit (GPU) market is categorized into tablet, computer, smartphone, gaming console, television, and others. The smartphone segment held the largest share of the Asia Pacific graphics processing unit (GPU) market in 2022.
Based on country, the Asia Pacific graphics processing unit (GPU) market is segmented into China, Japan, South Korea, Australia, India, and the Rest of Asia Pacific. China dominated the Asia Pacific graphics processing unit (GPU) market in 2022.
Advanced Micro Devices Inc, Apple Inc, ASUSTek Computer Inc, EVGA Corp, Imagination Technologies Ltd, Intel Corp, NVIDIA Corp, Qualcomm Inc, Samsung Electronics Co Ltd, and SAPPHIRE Technology Ltd are some of the leading companies operating in the Asia Pacific graphics processing unit (GPU) market.
Asia Pacific Graphics Processing Unit (GPU) Market Strategic Insights
Get more information on this report
Asia Pacific Graphics Processing Unit (GPU) Market Segmentation Analysis
Asia Pacific Graphics Processing Unit (GPU) Market Report Highlights
Asia Pacific Graphics Processing Unit (GPU) Report Scope
Report Attribute
Details
Market size in 2022
US$ 18,677.13 Million
Market Size by 2030
US$ 1,91,827.52 Million
CAGR (2022 - 2030)
33.8%
Historical Data
2020-2021
Forecast period
2023-2030
Segments Covered
By Type
Dedicated
Integrated
Hybrid
By Application
Tablet
Computer
Smartphone
Gaming Console
Television
Regions and Countries Covered
Asia-Pacific
China, India, Japan, Australia, Rest of Asia-Pacific
Market leaders and key company profiles
Advanced Micro Devices Inc
Apple Inc
ASUSTek Computer Inc
EVGA Corp
Imagination Technologies Ltd
Intel Corp
NVIDIA Corp
Qualcomm Inc
Samsung Electronics Co Ltd
SAPPHIRE Technology Ltd
Get more information on this report
Asia Pacific Graphics Processing Unit (GPU) Market Country and Regional Insights
Get more information on this report
Identical Market Reports with other Region/Countries
The List of Companies - Asia Pacific Graphics Processing Unit (GPU) Market
1. Advanced Micro Devices Inc2. Apple Inc3. ASUSTek Computer Inc4. EVGA Corp5. Imagination Technologies Ltd6. Intel Corp7. NVIDIA Corp8. Qualcomm Inc9. Samsung Electronics Co Ltd10. SAPPHIRE Technology Ltd
Frequently Asked Questions
How big is the Asia Pacific Graphics Processing Unit (GPU) Market?
The Asia Pacific Graphics Processing Unit (GPU) Market is valued at US$ 18,677.13 Million in 2022, it is projected to reach US$ 1,91,827.52 Million by 2030.
What is the CAGR for Asia Pacific Graphics Processing Unit (GPU) Market by (2022 - 2030)?
As per our report Asia Pacific Graphics Processing Unit (GPU) Market, the market size is valued at US$ 18,677.13 Million in 2022, projecting it to reach US$ 1,91,827.52 Million by 2030. This translates to a CAGR of approximately 33.8% during the forecast period.
What segments are covered in this report?
The Asia Pacific Graphics Processing Unit (GPU) Market report typically cover these key segments-
What is the historic period, base year, and forecast period taken for Asia Pacific Graphics Processing Unit (GPU) Market?
The historic period, base year, and forecast period can vary slightly depending on the specific market research report. However, for the Asia Pacific Graphics Processing Unit (GPU) Market report:
Historic Period : 2020-2021
Base Year : 2022
Forecast Period : 2023-2030
Who are the major players in Asia Pacific Graphics Processing Unit (GPU) Market?
The Asia Pacific Graphics Processing Unit (GPU) Market is populated by several key players, each contributing to its growth and innovation. Some of the major players include:
Advanced Micro Devices Inc
Apple Inc
ASUSTek Computer Inc
EVGA Corp
Imagination Technologies Ltd
Intel Corp
NVIDIA Corp
Qualcomm Inc
Samsung Electronics Co Ltd
SAPPHIRE Technology Ltd
Who should buy this report?
The Asia Pacific Graphics Processing Unit (GPU) Market report is valuable for diverse stakeholders, including:
Investors: Provides insights for investment decisions pertaining to market growth, companies, or industry insights. Helps assess market attractiveness and potential returns.
Industry Players: Offers competitive intelligence, market sizing, and trend analysis to inform strategic planning, product development, and sales strategies.
Suppliers and Manufacturers: Helps understand market demand for components, materials, and services related to concerned industry.
Researchers and Consultants: Provides data and analysis for academic research, consulting projects, and market studies.
Financial Institutions: Helps assess risks and opportunities associated with financing or investing in the concerned market.
Essentially, anyone involved in or considering involvement in the Asia Pacific Graphics Processing Unit (GPU) Market value chain can benefit from the information contained in a comprehensive market report.


 Get Free Sample For Asia Pacific Graphics Processing Unit (GPU) Market


