The Asia Pacific electronic toll collection system market was valued at US$ 1,227.46 million in 2022 and is expected to reach US$ 2,960.65 million by 2030; it is estimated to grow at a CAGR of 11.6% from 2022 to 2030.
Surging Demand for Effective Traffic Management at Toll Plaza Fuels Asia Pacific Electronic Toll Collection System Market
The state of road infrastructure plays an essential role in the economy's growth as it connects important small cities, towns, and metropolitan cities for freight transportation by road. Moreover, the continuous maintenance, expansion, and improvement of expressways, highways, bridges, and tunnels ensure the continuous, uninterrupted movement of goods, which contribute toward the respective country's GDP. However, the administrators face the challenge of maintaining road infrastructure growth along with the number of registered vehicles. As a result, the central or state government agency deploys various tolls for fees and levy tax across strategic locations on roadways for financing new infrastructure, controlling traffic, maintenance, and management of congestion of vehicles.
Rapid urbanization has driven the demand for a robust network of roads connecting cities and towns across the countries globally. Subsequently, this has boosted the investment toward the development of highways, bridges, and expressways for improved freight transportation by road. As a result, this is increasing the demand for efficient toll collection systems in the region's economies owing to the surge in the number of registered vehicles.
Globally, many companies and government authorities have signed contracts for deploying ETC. A mentioned below is one of them:
In January 2022, the National Highways Authority of India (NHAI) tested the Advanced Traffic Management System (ATMS). This new system is expected to be soon installed on all the national highways and expressways across the country.
In 2021, two 30-year contracts for toll operation on India's National Highway NH-44 were awarded to Egis.
Therefore, numerous contracts contributing to the demand for effective traffic management at toll plazas are anticipated to create lucrative business opportunities for ETC manufacturers and providers in the coming years.
Asia Pacific Electronic Toll Collection System Market Overview
According to the Ministry of Transport, China had more than 181 million electronic toll collection (ETC) operators in December 2019. The country has experienced 100.34 million new ETC users since May 15, 2022. The Ministry of China issued a circular to universalize freeway ETC devices, aiming to install these devices on over 80% of registered vehicles by year-end. The policy is aimed at relieving freeway traffic congestion and reducing emissions and logistics costs. Furthermore, the government of China is constructing new roads. For instance, in July 2022, China announced its plans to construct a highway network of 461,000 kilometers by 2035 and further increase it to become world-class by 2050. Also, with rural revitalization high on the government's agenda, the country stepped up investment in rural infrastructure. Some 60,000 km of rural roads were constructed in the first half of 2022, up 17.7% and 9.2% year-on-year, respectively. Therefore, with such factors, the deployment of electronic toll collection systems is increasing in China, thereby boosting market growth.
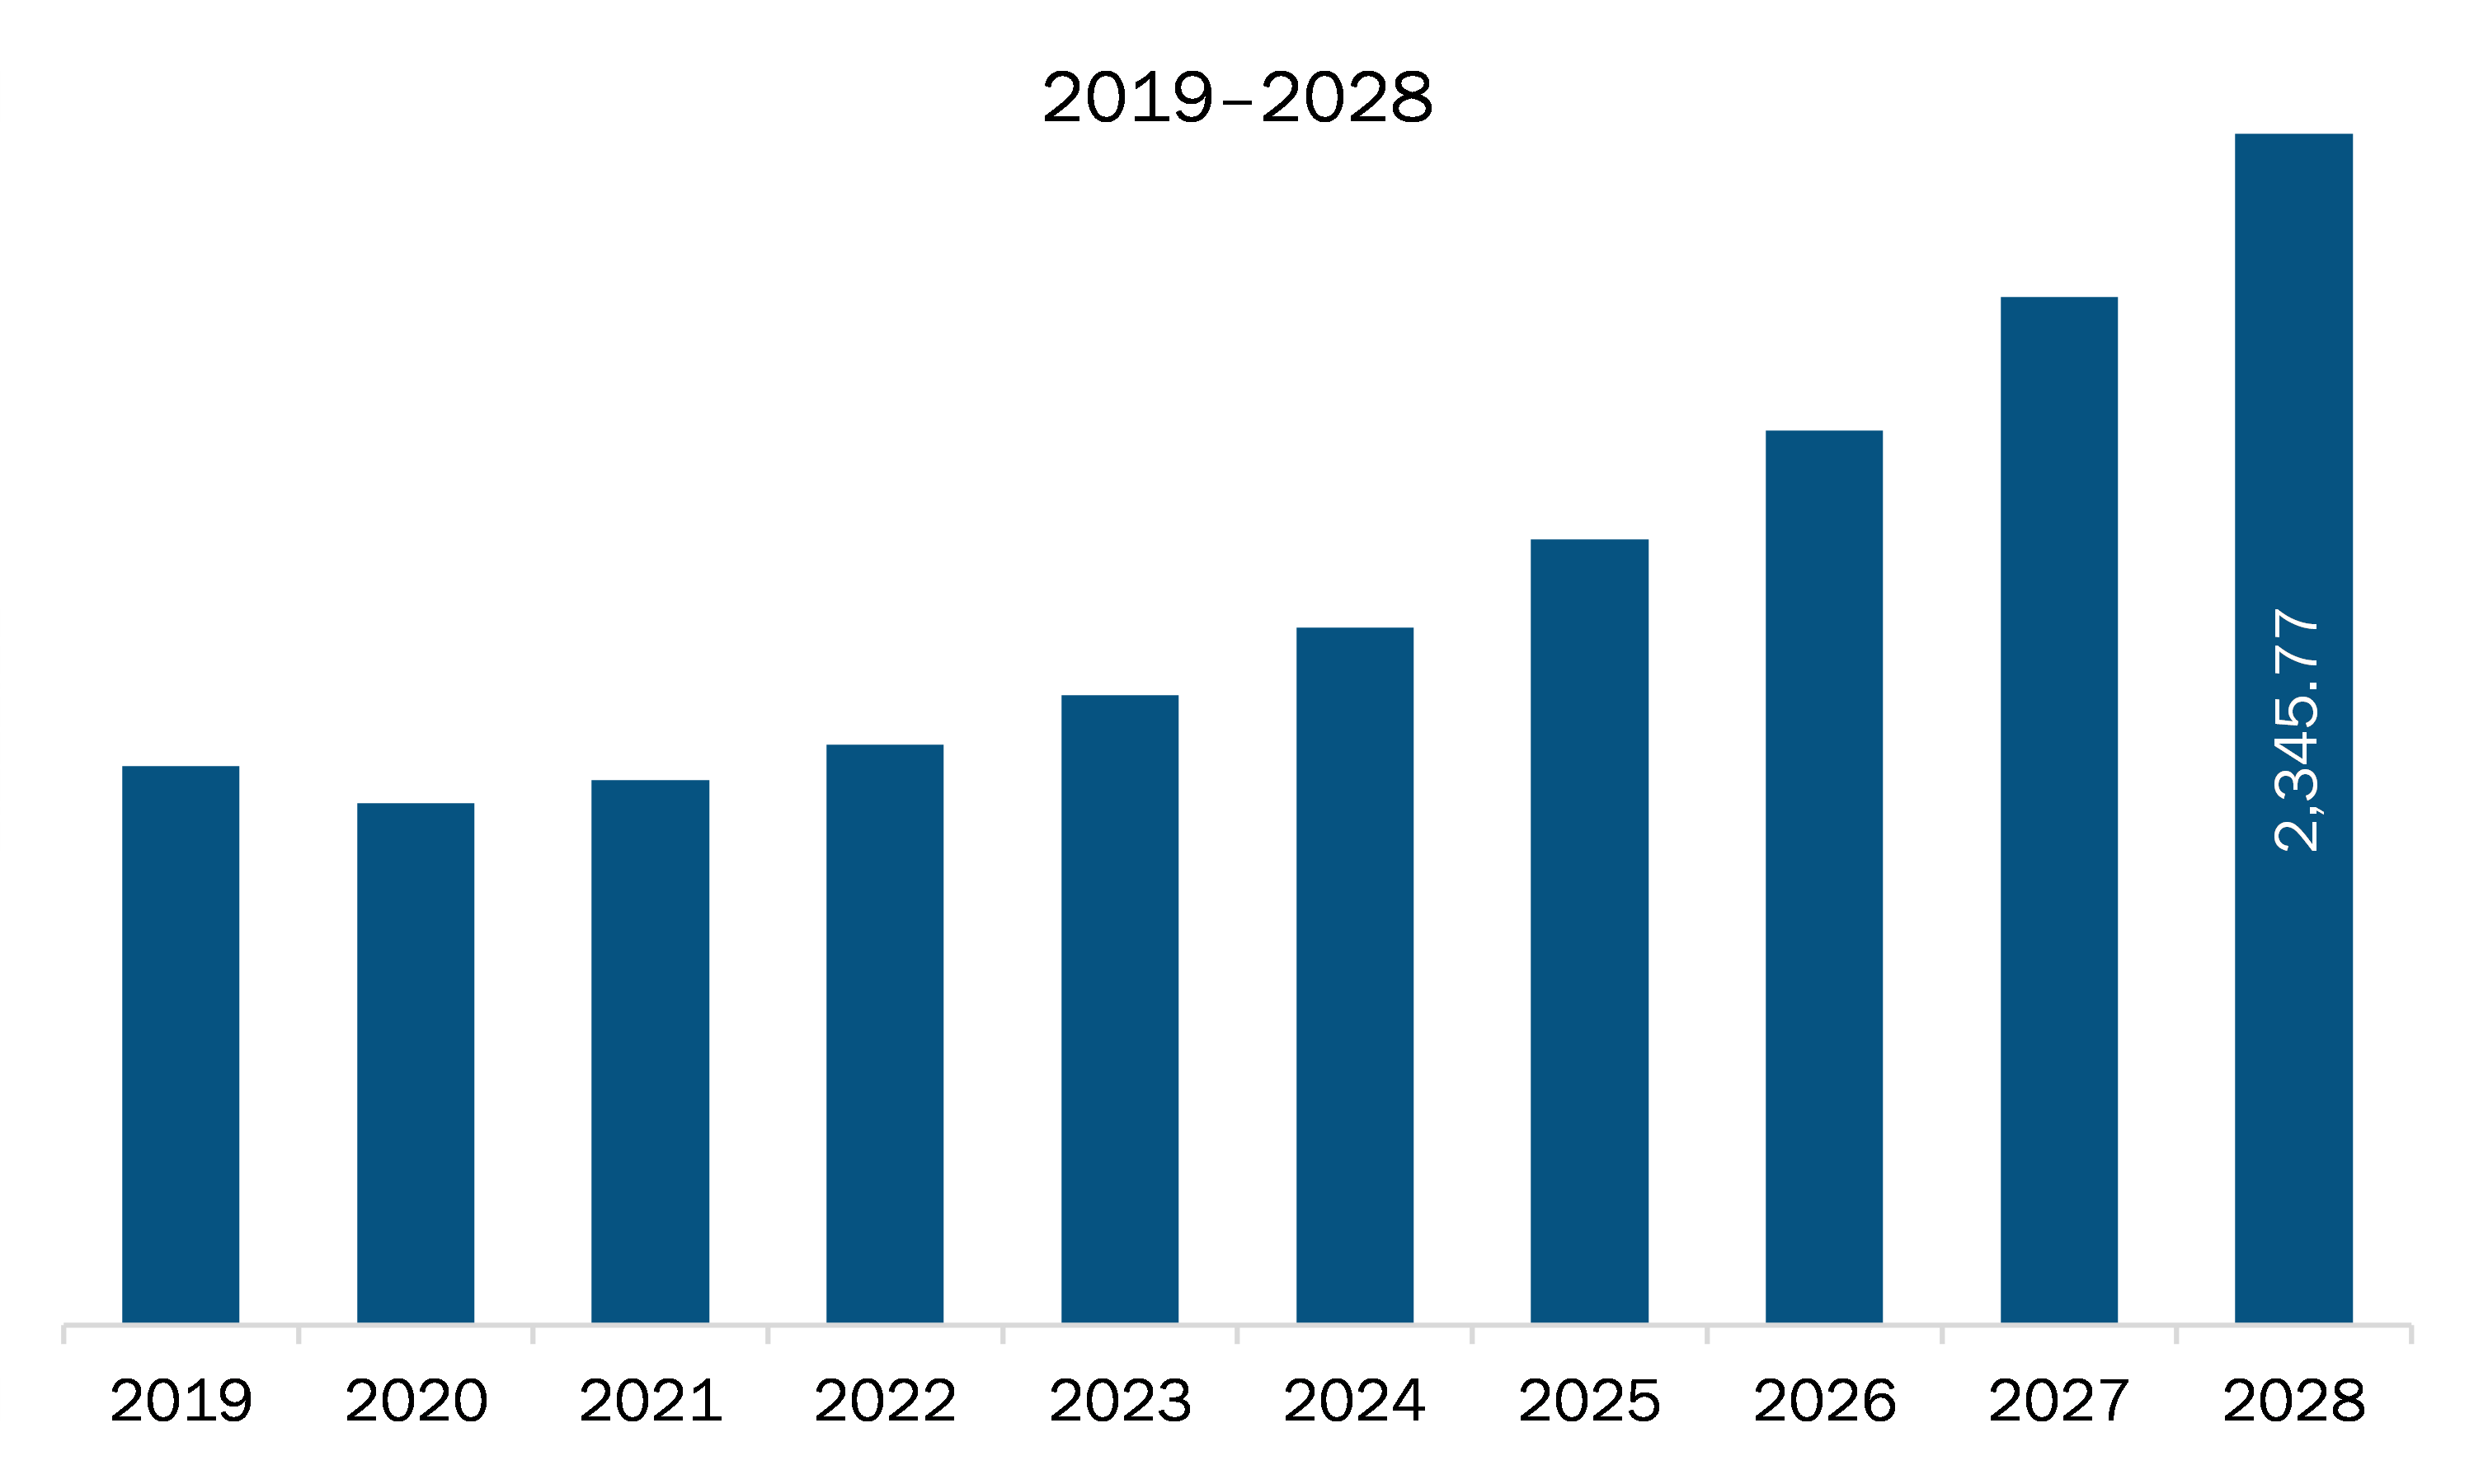
Asia Pacific Electronic Toll Collection System Market Revenue and Forecast to 2030 (US$ Million)
Asia Pacific Electronic Toll Collection System Market Segmentation
The Asia Pacific electronic toll collection system market is segmented based on offering, technology, application, and country. Based on offering, the Asia Pacific electronic toll collection system market is bifurcated into systems and services. The systems segment held a larger market share in 2022.
In terms of technology, the Asia Pacific electronic toll collection system market is segmented into RFID, DSRC, ANPR, GNSS, and others. The RFID segment held the largest market share in 2022.
By application, the Asia Pacific electronic toll collection system market is bifurcated into highways and urban zones. The highways segment held a larger market share in 2022.
Based on country, the Asia Pacific electronic toll collection system market is segmented into China, Japan, India, Australia, South Korea, and the Rest of Asia Pacific. China dominated the Asia Pacific electronic toll collection system market share in 2022.
Conduent Inc, Kapsch TrafficCom AG, Thales SA, Toshiba Infrastructure Systems and Solutions Corp, Magnetic Autocontrol GmbH, P Square Solutions LLC, Sociedad Iberica de Construcciones Electricas SA, Verra Mobility Corp, Mitsubishi Heavy Industries Ltd., Mitsubishi Heavy Industries Machinery Systems Ltd, Cubic Transportation Systems Inc, and Q-Free ASA are some of the leading companies operating in the Asia Pacific electronic toll collection system market.
Asia Pacific Electronic Toll Collection System Market Strategic Insights
Get more information on this report
Asia Pacific Electronic Toll Collection System Market Segmentation Analysis
Asia Pacific Electronic Toll Collection System Market Report Highlights
Asia Pacific Electronic Toll Collection System Report Scope
Report Attribute
Details
Market size in 2022
US$ 1,227.46 Million
Market Size by 2030
US$ 2,960.65 Million
CAGR (2022 - 2030)
11.6%
Historical Data
2020-2021
Forecast period
2023-2030
Segments Covered
By Offering
Systems
Services
By Technology
RFID
DSRC
ANPR
GNSS
By Application
Highways and Urban Zones
Regions and Countries Covered
Asia-Pacific
China, India, Japan, Australia, Rest of Asia-Pacific
Market leaders and key company profiles
Conduent Inc
Kapsch TrafficCom AG
Thales SA
Toshiba Infrastructure Systems and Solutions Corp
Magnetic Autocontrol GmbH
P Square Solutions LLC
Sociedad Iberica de Construcciones Electricas SA
Verra Mobility Corp
Mitsubishi Heavy Industries Ltd.
Cubic Transportation Systems, Inc
Mitsubishi Heavy Industries Machinery Systems Ltd
Q-Free ASA.
Get more information on this report
Asia Pacific Electronic Toll Collection System Market Country and Regional Insights
Get more information on this report
Identical Market Reports with other Region/Countries
The List of Companies - Asia Pacific Electronic Toll Collection System Market
1. Conduent Inc2. Kapsch TrafficCom AG3. Thales SA4. Toshiba Infrastructure Systems and Solutions Corp5. Magnetic Autocontrol GmbH6. P Square Solutions LLC7. Sociedad Iberica de Construcciones Electricas SA8. Verra Mobility Corp9. Mitsubishi Heavy Industries Ltd.10. Cubic Transportation Systems, Inc11. Mitsubishi Heavy Industries Machinery Systems Ltd12. Q-Free ASA.
Frequently Asked Questions
How big is the Asia Pacific Electronic Toll Collection System Market?
The Asia Pacific Electronic Toll Collection System Market is valued at US$ 1,227.46 Million in 2022, it is projected to reach US$ 2,960.65 Million by 2030.
What is the CAGR for Asia Pacific Electronic Toll Collection System Market by (2022 - 2030)?
As per our report Asia Pacific Electronic Toll Collection System Market, the market size is valued at US$ 1,227.46 Million in 2022, projecting it to reach US$ 2,960.65 Million by 2030. This translates to a CAGR of approximately 11.6% during the forecast period.
What segments are covered in this report?
The Asia Pacific Electronic Toll Collection System Market report typically cover these key segments-
Offering (Systems, Services)
Technology (RFID, DSRC, ANPR, GNSS)
Application (Highways and Urban Zones)
What is the historic period, base year, and forecast period taken for Asia Pacific Electronic Toll Collection System Market?
The historic period, base year, and forecast period can vary slightly depending on the specific market research report. However, for the Asia Pacific Electronic Toll Collection System Market report:
Historic Period : 2020-2021
Base Year : 2022
Forecast Period : 2023-2030
Who are the major players in Asia Pacific Electronic Toll Collection System Market?
The Asia Pacific Electronic Toll Collection System Market is populated by several key players, each contributing to its growth and innovation. Some of the major players include:
Conduent Inc
Kapsch TrafficCom AG
Thales SA
Toshiba Infrastructure Systems and Solutions Corp
Magnetic Autocontrol GmbH
P Square Solutions LLC
Sociedad Iberica de Construcciones Electricas SA
Verra Mobility Corp
Mitsubishi Heavy Industries Ltd.
Cubic Transportation Systems, Inc
Mitsubishi Heavy Industries Machinery Systems Ltd
Q-Free ASA.
Who should buy this report?
The Asia Pacific Electronic Toll Collection System Market report is valuable for diverse stakeholders, including:
Investors: Provides insights for investment decisions pertaining to market growth, companies, or industry insights. Helps assess market attractiveness and potential returns.
Industry Players: Offers competitive intelligence, market sizing, and trend analysis to inform strategic planning, product development, and sales strategies.
Suppliers and Manufacturers: Helps understand market demand for components, materials, and services related to concerned industry.
Researchers and Consultants: Provides data and analysis for academic research, consulting projects, and market studies.
Financial Institutions: Helps assess risks and opportunities associated with financing or investing in the concerned market.
Essentially, anyone involved in or considering involvement in the Asia Pacific Electronic Toll Collection System Market value chain can benefit from the information contained in a comprehensive market report.


 Get Free Sample For Asia Pacific Electronic Toll Collection System Market


