South America Virtual Reality and Augmented Reality in Retail Market Forecast to 2028 - COVID-19 Impact and Regional Analysis By Type (AR and VR) and Application (Online Retail and Offline Retail)
Market Introduction
The SAM virtual reality and augmented reality in retail market is sub segmented into Brazil, Argentina, and Rest of SAM. Several countries in SAM are substantially adopting various technologies to ease and overcome different challenges faced by the population in the respective countries. Infrastructure development is the key to the economic growth, leading to the rise in per capita incomes of Latin American countries. Infrastructure development facilitates productivity enhancement and competitiveness among the countries at the global level, in turn result in the economic development of the country. Commercial complexes, shopping malls, hypermarkets, non-food retail stores, supermarkets, and other types of businesses have sprung up as a result of large infrastructure projects in Latin America. These changes are expected to boost the retail industry's expansion across the area, which will have a beneficial impact on the growth of VR and AR in the retail market. Also, rise in adoption of virtual reality (VR) technology to offer better customer experience across online retail stores is the major factor driving the growth of the APAC virtual reality and augmented reality in retail market.
Brazil has reported the largest number of cases of COVID-19 in South America, followed by Ecuador, Chile, Peru, and Argentina, among others. The pandemic has compelled several country governments to impose lockdowns and suspend economic activities to contain the spread of the virus. Owing to the strict lockdown measures imposed by the governing bodies, the countries experienced a decline in the retail business. However, global brands have made huge investments in the AR and VR technology during the pandemic to offer better customer shopping experience even at their home. This have influenced the growth of local AR VR market players across the region, thereby leaving positive impact in the market growth.
Get more information on this report :
Market Overview and Dynamics
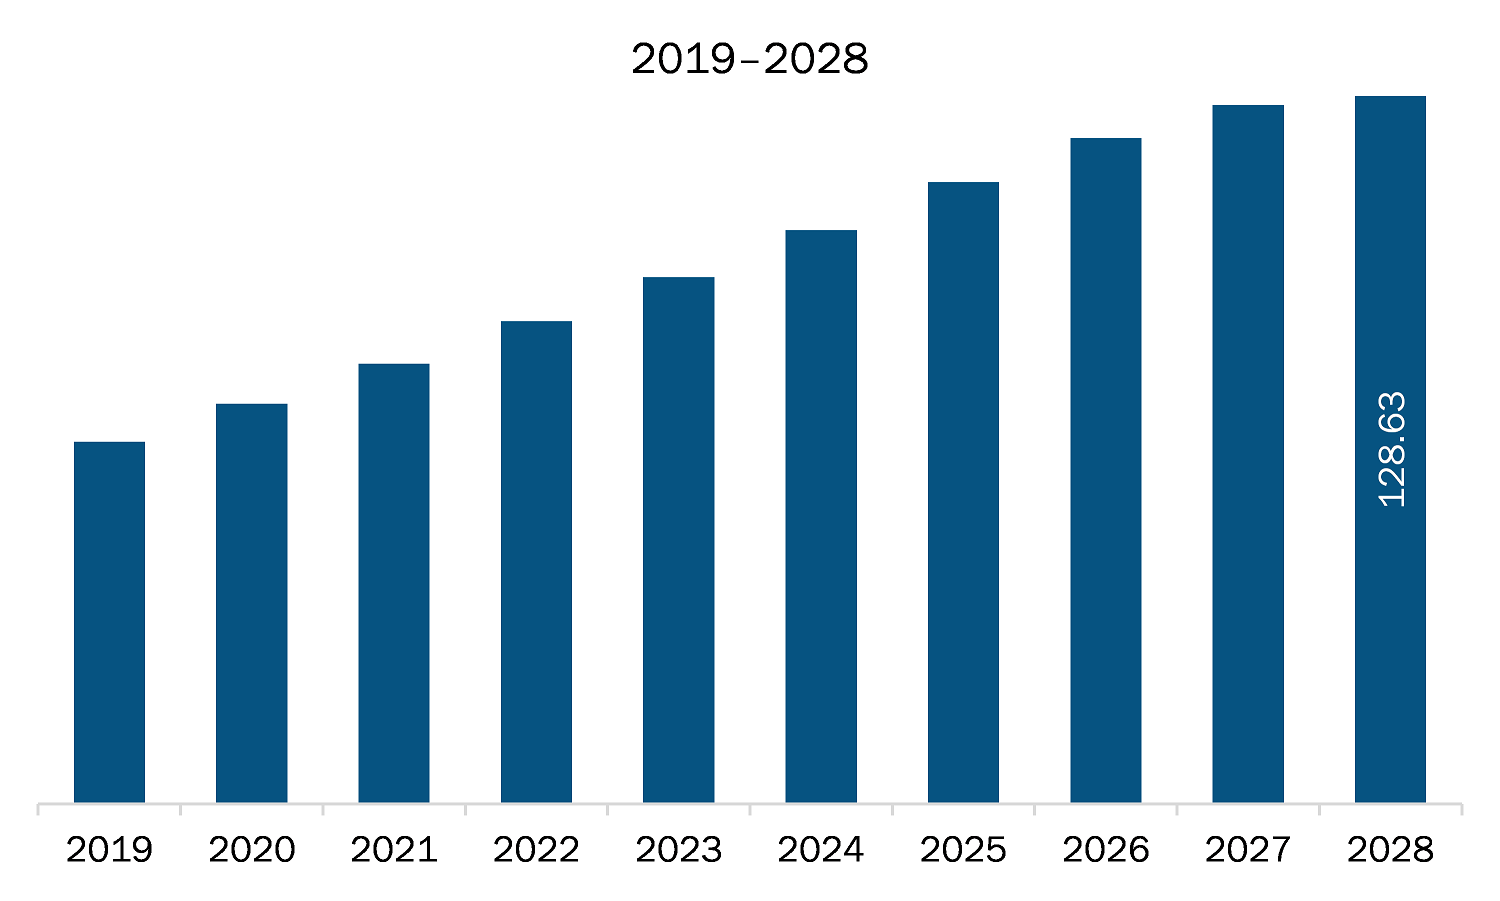
The virtual reality and augmented reality in retail market in SAM is expected to grow from US$ 79.99 million in 2021 to US$ 128.63 million by 2028; it is estimated to grow at a CAGR of 7.0% from 2021 to 2028. Mixed reality technologies such as AR and VR, provide a lot of promise for businesses to give customers new ways to interact with their brands, whether it is through taking them to another world or enriching the one they are in right now. Due to developments in mobile technology, augmented reality has grown in popularity in recent years, allowing customers to visualize and test things before purchasing them. Various retail brands are thereby investing in the technologies. Thus, the rise in investment by SAM retail businesses in AR and VR technologies in expected to fuel the growth of the AR and VR in retail market over the forecast period.
Key Market Segments
The APAC virtual reality and augmented reality in retail market is segmented into type, application, and country. In terms of type, the virtual reality and augmented reality in retail market is bifurcated into augmented reality and virtual reality. The AR segment dominated the market in the year 2020 and is expected to be the fastest growing during forecast period. Based on application, the virtual reality and augmented reality in retail market is categorized into online retail and offline retail. The online retail segment dominated the market in the year 2020 and is expected to be the fastest growing during forecast period.
Major Sources and Companies Listed
A few major primary and secondary sources referred to for preparing this report on the virtual reality and augmented reality in retail market in APAC are company websites, annual reports, financial reports, national government documents, and statistical database, among others. Major companies listed in the report are Epson America, Inc.; Google LLC; Infosys Ltd.; Intel Corporation; Microsoft Corporation; PTC Inc.; Qualcomm Technologies, Inc.; and Samsung Electronics Co., Ltd. among others.
Reasons to buy report
- To understand the APAC virtual reality and augmented reality in retail market landscape and identify market segments that are most likely to guarantee a strong return
- Stay ahead of the race by comprehending the ever-changing competitive landscape for APAC virtual reality and augmented reality in retail market
- Efficiently plan M&A and partnership deals in APAC virtual reality and augmented reality in retail market by identifying market segments with the most promising probable sales
- Helps to take knowledgeable business decisions from perceptive and comprehensive analysis of market performance of various segment form APAC virtual reality and augmented reality in retail market
- Obtain market revenue forecast for market by various segments from 2021-2028 in APAC region.
APAC Virtual Reality and Augmented Reality in Retail Market Segmentation
APAC Virtual Reality and Augmented Reality in Retail Market -By Type
- AR
- VR
APAC Virtual Reality and Augmented Reality in Retail Market –By Application
- Online Retail
- Offline Retail
APAC Virtual Reality and Augmented Reality in Retail Market -By Country
- Brazil
- Argentina
- Rest of SAM
APAC Virtual Reality and Augmented Reality in Retail Market -Company Profiles
- Epson America, Inc.
- Google LLC
- Infosys Ltd.
- Intel Corporation
- Microsoft Corporation
- PTC Inc.
- Qualcomm Technologies, Inc.
- Samsung Electronics Co., Ltd.
1. Introduction
1.1 Study Scope
1.2 The Insight Partners Research Report Guidance
1.3 Market Segmentation
2. Key Takeaways
3. Research Methodology
3.1 Coverage
3.2 Secondary Research
3.3 Primary Research
4. SAM Virtual Reality and Augmented Reality in Retail Market Landscape
4.1 Market Overview
4.2 SAM PEST Analysis
4.3 Ecosystem Analysis
4.4 Expert Opinion
5. SAM Virtual Reality and Augmented Reality in Retail Market – Key Market Dynamics
5.1 Market Drivers
5.1.1 Rise in Adoption of Virtual Reality (VR) Technology to Offer Better Customer Experience Across Online Retail Stores
5.1.2 Surge in Adoption of AR and VR in Marketing
5.2 Market Restraints
5.2.1 Security and Privacy Issues Associated with AR
5.3 Market Opportunities
5.3.1 Soaring Investments by Retailers on AR and VR Technologies
5.4 Future Trends
5.4.1 High Adoption Across Retail Brands for Implementing Virtual Fitting Technology
5.5 Impact Analysis of Drivers and Restraints
6. Virtual Reality and Augmented Reality in Retail Market SAM Analysis
6.1 SAM Virtual Reality and Augmented Reality in Retail Market Overview
7. SAM Reality in Retail Market Analysis – by Type
7.1 Overview
7.2 SAM Virtual Reality and Augmented Reality in Retail Market Breakdown, by Type, 2020 and 2028
7.3 AR
7.3.1 Overview
7.3.2 AR: Virtual Reality and Augmented Reality in Retail Market Revenue and Forecast to 2028 (US$ Million)
7.4 VR
7.4.1 Overview
7.4.2 VR: Virtual Reality and Augmented Reality in Retail Market Revenue and Forecast to 2028 (US$ Million)
8. SAM Virtual Reality and Augmented Reality in Retail Market Analysis – by Application
8.1 Overview
8.2 SAM Virtual Reality and Augmented Reality in Retail Market, by Application (2020 and 2028)
8.3 Online Retail
8.3.1 Overview
8.3.2 Online Retail: Virtual Reality and Augmented Reality in Retail Market – Revenue and Forecast to 2028 (US$ Million)
8.4 Offline Retail
8.4.1 Overview
8.4.2 Offline Retail: Virtual Reality and Augmented Reality in Retail Market – Revenue and Forecast to 2028 (US$ Million)
9. SAM Virtual Reality and Augmented Reality in Retail Market – Country Analysis
9.1 Overview
9.1.1 SAM Virtual Reality and Augmented Reality in Retail Market Breakdown, by Key Country
9.1.1.1 Brazil Virtual Reality and Augmented Reality in Retail Market, Revenue and Forecast to 2028
9.1.1.1.1 Brazil Virtual Reality and Augmented Reality in Retail Market Breakdown, by Type
9.1.1.1.2 Brazil Virtual Reality and Augmented Reality in Retail Market Breakdown, by Application
9.1.1.2 Argentina Virtual Reality and Augmented Reality in Retail Market, Revenue and Forecast to 2028
9.1.1.2.1 Argentina Virtual Reality and Augmented Reality in Retail Market Breakdown, by Type
9.1.1.2.2 Argentina Virtual Reality and Augmented Reality in Retail Market Breakdown, by Application
9.1.1.3 Rest of SAM Virtual Reality and Augmented Reality in Retail Market, Revenue and Forecast to 2028
9.1.1.3.1 Rest of SAM Virtual Reality and Augmented Reality in Retail Market Breakdown, by Type
9.1.1.3.2 Rest of SAM Virtual Reality and Augmented Reality in Retail Market Breakdown, by Application
10. Impact of COVID-19 Pandemic on SAM Virtual Reality and Augmented Reality in Retail Market
10.1 Overview
11. Virtual Reality and Augmented Reality in Retail Market-Industry Landscape
11.1 Overview
11.2 Market Initiative
11.3 New Product Development
12. Company Profiles
12.1 Epson America, Inc.
12.1.1 Key Facts
12.1.2 Business Description
12.1.3 Products and Services
12.1.4 Financial Overview
12.1.5 SWOT Analysis
12.1.6 Key Developments
12.2 Google LLC
12.2.1 Key Facts
12.2.2 Business Description
12.2.3 Products and Services
12.2.4 Financial Overview
12.2.5 SWOT Analysis
12.2.6 Key Developments
12.3 Infosys Ltd.
12.3.1 Key Facts
12.3.2 Business Description
12.3.3 Products and Services
12.3.4 Financial Overview
12.3.5 SWOT Analysis
12.3.6 Key Developments
12.4 Intel Corporation
12.4.1 1.5.1 Key Facts
12.4.2 Business Description
12.4.3 Products and Services
12.4.4 Financial Overview
12.4.5 SWOT Analysis
12.4.6 Key Developments
12.5 Microsoft Corporation
12.5.1 Key Facts
12.5.2 Business Description
12.5.3 Products and Services
12.5.4 Financial Overview
12.5.5 SWOT Analysis
12.5.6 Key Developments
12.6 PTC Inc.
12.6.1 Key Facts
12.6.2 Business Description
12.6.3 Products and Services
12.6.4 Financial Overview
12.6.5 SWOT Analysis
12.6.6 Key Developments
12.7 Qualcomm Technologies, Inc.
12.7.1 Key Facts
12.7.2 Business Description
12.7.3 Products and Services
12.7.4 Financial Overview
12.7.5 SWOT Analysis
12.7.6 Key Developments
12.8 Samsung Electronics Co., Ltd.
12.8.1 Key Facts
12.8.2 Business Description
12.8.3 Products and Services
12.8.4 Financial Overview
12.8.5 SWOT Analysis
12.8.6 Key Developments
13. Appendix
13.1 About The Insight Partners
13.2 Glossary of Terms
LIST OF TABLES
Table 1. SAM Virtual Reality and Augmented Reality in Retail Market – Revenue and Forecast to 2028 (US$ Million)
Table 2. SAM Virtual Reality and Augmented Reality in Retail Market, Revenue and Forecast To 2028 – By Country (US$ Mn)
Table 3. Brazil Virtual Reality and Augmented Reality in Retail Market, Revenue and Forecast to 2028 – By Type (US$ Mn)
Table 4. Brazil Virtual Reality and Augmented Reality in Retail Market, Revenue and Forecast to 2028 – By Application (US$ Mn)
Table 5. Argentina Virtual Reality and Augmented Reality in Retail Market, Revenue and Forecast to 2028 – By Type (US$ Mn)
Table 6. Argentina Virtual Reality and Augmented Reality in Retail Market, Revenue and Forecast to 2028 – By Application (US$ Mn)
Table 7. Rest of SAM Virtual Reality and Augmented Reality in Retail Market, Revenue and Forecast to 2028 – By Type (US$ Mn)
Table 8. Rest of SAM Virtual Reality and Augmented Reality in Retail Market, Revenue and Forecast to 2028 – By Application (US$ Mn)
Table 9. Glossary of Term: Virtual Reality and Augmented Reality in Retail Market
LIST OF FIGURES
Figure 1. SAM Virtual Reality and Augmented Reality in Retail Market Segmentation
Figure 2. SAM Virtual Reality and Augmented Reality in Retail Market Segmentation – By Country
Figure 3. SAM Virtual Reality and Augmented Reality in Retail Market Overview
Figure 4. AR Segment is Expected to Dominate the SAM Virtual Reality and Augmented Reality in Retail Market by Type
Figure 5. Online Retail Segment held Largest SAM Virtual Reality and Augmented Reality in Retail Market Share in 2020
Figure 6. Brazil held Largest Market Share in 2020
Figure 7. SAM: PEST Analysis
Figure 8. Expert Opinion
Figure 9. SAM Virtual Reality and Augmented Reality in Retail Market: Impact Analysis of Drivers and Restraints
Figure 10. SAM Virtual Reality and Augmented Reality in Retail Market – Revenue and Forecast to 2028 (US$ Million)
Figure 11. SAM Virtual Reality and Augmented Reality in Retail Market Revenue Share, by Type (2020 and 2028)
Figure 12. SAM AR: Virtual Reality and Augmented Reality in Retail Market Revenue and Forecast to 2028 (US$ Million)
Figure 13. SAM VR: Virtual Reality and Augmented Reality in Retail Market Revenue and Forecast to 2028 (US$ Million)
Figure 14. SAM Virtual Reality and Augmented Reality in Retail Market Revenue Share, by Application (2020 and 2028)
Figure 15. SAM Online Retail: Virtual Reality and Augmented Reality in Retail Market – Revenue and Forecast to 2028 (US$ Million)
Figure 16. SAM Offline Retail: Virtual Reality and Augmented Reality in Retail Market – Revenue and Forecast to 2028 (US$ Million)
Figure 17. SAM Virtual Reality and Augmented Reality in Retail Market, by Key Country-Revenue 2020 (US$ Million )
Figure 18. SAM Virtual Reality and Augmented Reality in Retail Market Breakdown, by Key Country,( 2020 & 2028)
Figure 19. Brazil Virtual Reality and Augmented Reality in Retail Market, Revenue and Forecast, 2018–2028 (US$ Mn)
Figure 20. Argentina Virtual Reality and Augmented Reality in Retail Market, Revenue and Forecast, 2018–2028 (US$ Mn)
Figure 21. Rest of SAM Virtual Reality and Augmented Reality in Retail Market, Revenue and Forecast, 2018–2028 (US$ Mn)
Figure 22. Impact of COVID-19 Pandemic in South America Country Markets
- Epson America, Inc.
- Google LLC
- Infosys Ltd.
- Intel Corporation
- Microsoft Corporation
- PTC Inc.
- Qualcomm Technologies, Inc.
- Samsung Electronics Co., Ltd.
- Save and reduce time carrying out entry-level research by identifying the growth, size, leading players and segments in the SAM Virtual Reality and Augmented Reality in Retail Market.
- Highlights key business priorities in order to assist companies to realign their business strategies
- The key findings and recommendations highlight crucial progressive industry trends in the SAM Virtual Reality and Augmented Reality in Retail market, thereby allowing players across the value chain to develop effective long-term strategies
- Develop/modify business expansion plans by using substantial growth offering developed and emerging markets
- Scrutinize in-depth SAM market trends and outlook coupled with the factors driving Virtual Reality and Augmented Reality in Retail market, as well as those hindering it
- Enhance the decision-making process by understanding the strategies that underpin commercial interest with respect to client products, segmentation, pricing and distribution