South America Data Bus Market Forecast to 2028 – COVID-19 Impact and Regional Analysis – by Component (Hardware and Software), Protocol (Arinc 429/629, Mil-Std 1553, and Others), and Application (Marine, Automotive, Commercial Aviation, and Military Aviation)
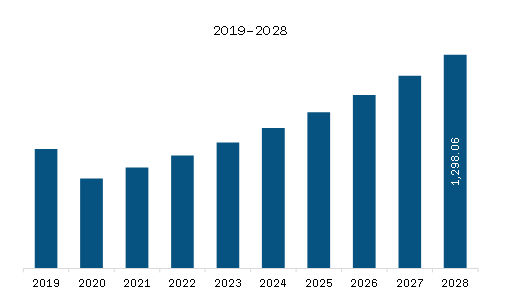
The SAM data bus market is expected to grow from US$ 1,114.23 million in 2021 to US$ 1,298.06 million by 2028; it is estimated to grow at a CAGR of 2.2% from 2021 to 2028.
On the onboard bus, there is an upsurge in traffic. Remote terminals expect improved services from the onboard bus as they become more "intelligent." They expect to access the bus on demand to transfer data packets. Many current software architectures are built around messaging capabilities, in which programs communicate via variable-length messages generated asynchronously. Because of the growing "intelligence" of remote terminals, their expectations for more complete communication services, and the necessity to support increasingly sophisticated, multi-bus designs, higher-level protocols are being used more frequently on the onboard bus. This, in turn, may increase traffic volume, particularly asynchronous traffic, but it also emphasizes the necessity for the onboard bus to provide asymmetric medium access service. While asynchronous packet traffic on spacecraft buses has been steadily increasing, the number of basic sensors and actuators that must be serviced through the bus has remained constant. In reality, there is strong evidence that such low-cost gadgets are increasing. The MIL-STD-1553B command and control bus is the most frequent aboard a spacecraft, and the additions in ECSS-E-ST-50-13C cover it for future space use. However, as processing power grows and sub-systems become more complex, there is a growing demand for data networks that meet MIL-STD-1553B requirements while also being compatible with the miniaturized low-power devices they connect. Pin counts, connector sizes, and harness bulk can all be reduced in this way. The awareness that the building block method demands standardization above the basic bus protocols goes hand in hand with the requirement to improve connectivity. Future data system innovations include, among other things, the adoption of the CAN bus as a complement to MIL-STD-1553B, the creation and usage of higher-layer protocols, and the standardization of digital sensor buses as the most efficient means to decrease harness and integration costs. Therefore, growing high performance data buses is expected to fuel the SAM market growth.
With the new features and technologies, vendors can attract new customers and expand their footprints in emerging markets. This factor is likely to drive the SAM data bus market in the coming years. The market is expected to grow at a good CAGR during the forecast period.
SAM Data Bus Market Revenue and Forecast to 2028 (US$ Million)
Get more information on this report :
SAM Data Bus Market Segmentation
The SAM data bus market has been segmented and analyzed on the basis of component, protocol, application, and country. Based on component, the SAM data bus market is further segmented into hardware and software. The hardware segment dominated the SAM data bus market in 2020 and software segment is expected to be fastest growing during forecast period. On the basis of protocol, the SAM data bus market is segmented into ARINC 429/629, MIL–STD-1553, and others. The MIL–STD-1553 segment dominated the SAM data bus market in 2020 and ARINC 429/629 segment is expected to be fastest growing during forecast period. On the basis of application, the SAM data bus market is further segmented into automotive, marine, commercial aviation, and military aviation. The military aviation segment dominated the SAM data bus market in 2020 and same segment is expected to be fastest growing during forecast period. Based on country, the SAM data bus market is segmented into Brazil, Argentina, and the rest of SAM.
Collins Aerospace, Data Device Corporation, Fujikura Ltd., HUBER+SUHNER, Nexans, and TE Connectivity Corporation are among the leading companies in the SAM data bus market.
1. Introduction
1.1 Study Scope
1.2 The Insight Partners Research Report Guidance
1.3 Market Segmentation
2. Key Takeaways
3. Research Methodology
3.1 Coverage
3.2 Secondary Research
3.3 Primary Research
4. SAM Data Bus Market Landscape
4.1 Market Overview
4.2 SAM PEST Analysis
4.3 Ecosystem Analysis
5. SAM Data Bus Market – Key Market Dynamics
5.1 Market Drivers
5.1.1 Ongoing Modernization in Military Aviation
5.1.2 Electrification in Automotive Sector
5.2 Market Restraints
5.2.1 Problems Pertaining to Serial Data bus
5.3 Future Trends
5.3.1 High Performance Data Buses
5.4 Impact Analysis of Drivers and Restraints
6. Data Bus Market – SAM Analysis
6.1 SAM Data Bus Market Overview
6.2 SAM Data Bus Market Revenue Forecast and Analysis
7. SAM Data Bus Market Analysis – By Component
7.1 Overview
7.2 SAM Data Bus Market, By Component (2020 and 2028)
7.3 Hardware
7.3.1 Overview
7.3.2 Hardware: Data Bus Market – Revenue and Forecast to 2028 (US$ Million)
7.3.2.1 Cables and Connectors
7.3.2.1.1 Overview
7.3.2.1.2 Cables and Connectors: Data Bus Market – Revenue and Forecast to 2028 (US$ Million)
7.3.2.2 Assemblies/Terminators
7.3.2.2.1 Overview
7.3.2.2.2 Assemblies/Terminators: Data Bus Market – Revenue and Forecast to 2028 (US$ Million)
7.3.2.3 Data Bus Couplers
7.3.2.3.1 Overview
7.3.2.3.2 Data Bus Couplers: Data Bus Market – Revenue and Forecast to 2028 (US$ Million)
7.3.2.4 Interface Cards/Boards
7.3.2.4.1 Overview
7.3.2.4.2 Interface Cards/Boards: Data Bus Market – Revenue and Forecast to 2028 (US$ Million)
7.3.2.5 Others
7.3.2.5.1 Overview
7.3.2.5.2 Others: Data Bus Market – Revenue and Forecast to 2028 (US$ Million)
7.4 Software
7.4.1 Overview
7.4.2 Software: Data Bus Market – Revenue and Forecast to 2028 (US$ Million)
8. SAM Data Bus Market Analysis – By Protocol
8.1 Overview
8.2 SAM Data Bus Market, By Protocol (2020 and 2028)
8.3 Arinc 429/629
8.3.1 Overview
8.3.2 Arinc 429/629: Data Bus Market – Revenue and Forecast to 2028 (US$ Million)
8.4 Mil-Std 1553
8.4.1 Overview
8.4.2 Mil-Std 1553: Data Bus Market – Revenue and Forecast to 2028 (US$ Million)
8.5 Others
8.5.1 Overview
8.5.2 Others: Data Bus Market – Revenue and Forecast to 2028 (US$ Million)
9. SAM Data Bus Market Analysis – By Application
9.1 Overview
9.2 SAM Data Bus Market, By Application (2020 and 2028)
9.4 Marine
9.4.1 Overview
9.4.2 Marine: Data Bus Market – Revenue and Forecast to 2028 (US$ Million)
9.5 Automotive
9.5.1 Overview
9.5.2 Automotive: Data Bus Market – Revenue and Forecast to 2028 (US$ Million)
9.6 Commercial Aviation
9.6.1 Overview
9.6.2 Commercial Aviation: Data Bus Market – Revenue and Forecast to 2028 (US$ Million)
9.7 Military Aviation
9.7.1 Overview
9.7.2 Military Aviation: Data Bus Market – Revenue and Forecast to 2028 (US$ Million)
10. SAM Data Bus Market – Country Analysis
10.1 Overview
10.1.1 SAM: Data Bus Market, by Key Country
10.1.1.1 Brazil: Data Bus Market – Revenue and Forecast to 2028 (US$ Million)
10.1.1.1.1 Brazil: Data Bus Market, by Component
10.1.1.1.2 Brazil: Data Bus Market, by Protocol
10.1.1.1.3 Brazil: Data Bus Market, by Application
10.1.1.1.4 Brazil: Data Bus Market, by Hardware
10.1.1.2 Argentina: Data Bus Market – Revenue and Forecast to 2028 (US$ Million)
10.1.1.2.1 Argentina: Data Bus Market, by Component
10.1.1.2.2 Argentina: Data Bus Market, by Protocol
10.1.1.2.3 Argentina: Data Bus Market, by Application
10.1.1.2.4 Argentina: Data Bus Market, by Hardware
10.1.1.3 Rest of SAM: Data Bus Market – Revenue and Forecast to 2028 (US$ Million)
10.1.1.3.1 Rest of SAM: Data Bus Market, by Component
10.1.1.3.2 Rest of SAM: Data Bus Market, by Protocol
10.1.1.3.3 Rest of SAM: Data Bus Market, by Application
10.1.1.3.4 Rest of SAM: Data Bus Market, by Hardware
11. Industry Landscape
11.1 Overview
11.2 Market Initiative
11.3 New Product Development
12. Company Profiles
12.1 Collins Aerospace
12.1.1 Key Facts
12.1.2 Business Description
12.1.3 Products and Services
12.1.4 Financial Overview
12.1.5 SWOT Analysis
12.1.6 Key Developments
12.2 Fujikura Ltd.
12.2.1 Key Facts
12.2.2 Business Description
12.2.3 Products and Services
12.2.4 Financial Overview
12.2.5 SWOT Analysis
12.2.6 Key Developments
12.3 HUBER+SUHNER
12.3.1 Key Facts
12.3.2 Business Description
12.3.3 Products and Services
12.3.4 Financial Overview
12.3.5 SWOT Analysis
12.3.6 Key Developments
12.4 Nexans
12.4.1 Key Facts
12.4.2 Business Description
12.4.3 Products and Services
12.4.4 Financial Overview
12.4.5 SWOT Analysis
12.4.6 Key Developments
12.5 TE Connectivity Corporation
12.5.1 Key Facts
12.5.2 Business Description
12.5.3 Products and Services
12.5.4 Financial Overview
12.5.5 SWOT Analysis
12.5.6 Key Developments
12.6 Data Device Corporation
12.6.1 Key Facts
12.6.2 Business Description
12.6.3 Products and Services
12.6.4 Financial Overview
12.6.5 SWOT Analysis
12.6.6 Key Developments
13. Appendix
13.1 About The Insight Partners
13.2 Word Index
LIST OF TABLES
Table 1. SAM Data Bus Market Revenue and Forecast to 2028 (US$ Million)
Table 2. SAM: Data Bus Market, by Country – Revenue and Forecast to 2028 (US$ Million)
Table 3. Brazil: Data Bus Market, by Component – Revenue and Forecast to 2028 (US$ Million)
Table 4. Brazil: Data Bus Market, by Protocol – Revenue and Forecast to 2028 (US$ Million)
Table 5. Brazil: Data Bus Market, by Application – Revenue and Forecast to 2028 (US$ Million)
Table 6. Brazil: Data Bus Market, by Hardware – Revenue and Forecast to 2028 (US$ Million)
Table 7. Argentina: Data Bus Market, by Component – Revenue and Forecast to 2028 (US$ Million)
Table 8. Argentina: Data Bus Market, by Protocol – Revenue and Forecast to 2028 (US$ Million)
Table 9. Argentina: Data Bus Market, by Application – Revenue and Forecast to 2028 (US$ Million)
Table 10. Argentina: Data Bus Market, by Hardware – Revenue and Forecast to 2028 (US$ Million)
Table 11. Rest of SAM: Data Bus Market, by Component – Revenue and Forecast to 2028 (US$ Million)
Table 12. Rest of SAM: Data Bus Market, by Protocol – Revenue and Forecast to 2028 (US$ Million)
Table 13. Rest of SAM: Data Bus Market, by Application – Revenue and Forecast to 2028 (US$ Million)
Table 14. Rest of SAM: Data Bus Market, by Hardware – Revenue and Forecast to 2028 (US$ Million)
Table 15. List of Abbreviation
LIST OF FIGURES
Figure 1. SAM Data Bus Market Segmentation
Figure 2. SAM Data Bus Market Segmentation – By Country
Figure 3. SAM Data Bus Market Overview
Figure 4. SAM Data Bus Market, by Component
Figure 5. SAM Data Bus Market, By Country
Figure 6. SAM
Figure 7. SAM Data Bus Market: Ecosystem Analysis
Figure 8. SAM Data Bus Market: Impact Analysis of Drivers and Restraints
Figure 9. SAM Data Bus Market Revenue Forecast and Analysis (US$ Million)
Figure 10. SAM Data Bus Market Revenue Share, By Component (2020 and 2028)
Figure 11. SAM Hardware: Data Bus Market – Revenue and Forecast to 2028 (US$ Million)
Figure 12. SAM Cables and Connectors: Data Bus Market – Revenue and Forecast to 2028 (US$ Million)
Figure 13. SAM Assemblies/Terminators: Data Bus Market – Revenue and Forecast to 2028 (US$ Million)
Figure 14. SAM Data Bus Couplers: Data Bus Market – Revenue and Forecast to 2028 (US$ Million)
Figure 15. SAM Interface Cards/Boards: Data Bus Market – Revenue and Forecast to 2028 (US$ Million)
Figure 16. SAM Others: Data Bus Market – Revenue and Forecast to 2028 (US$ Million)
Figure 17. SAM Software: Data Bus Market – Revenue and Forecast to 2028 (US$ Million)
Figure 18. SAM Data Bus Market Revenue Share, by Protocol (2020 and 2028)
Figure 19. SAM Arinc 429/629: Data Bus Market – Revenue and Forecast to 2028 (US$ Million)
Figure 20. SAM Mil-Std 1553: Data Bus Market – Revenue and Forecast to 2028 (US$ Million)
Figure 21. SAM Others: Data Bus Market – Revenue and Forecast to 2028 (US$ Million)
Figure 22. SAM Data Bus Market Revenue Share, by Application (2020 and 2028)
Figure 23. SAM Marine: Data Bus Market – Revenue and Forecast to 2028 (US$ Million)
Figure 24. SAM Automotive: Data Bus Market – Revenue and Forecast to 2028 (US$ Million)
Figure 25. SAM Commercial Aviation: Data Bus Market – Revenue and Forecast to 2028 (US$ Million)
Figure 26. SAM Military Aviation: Data Bus Market – Revenue and Forecast to 2028 (US$ Million)
Figure 27. SAM: Data Bus Market, by Key Country – Revenue (2020) (US$ Million)
Figure 28. SAM: Data Bus Market Revenue Share, by Key Country (2020 & 2028)
Figure 29. Brazil: Data Bus Market – Revenue and Forecast to 2028 (US$ Million)
Figure 30. Argentina: Data Bus Market – Revenue and Forecast to 2028 (US$ Million)
Figure 31. Rest of SAM: Data Bus Market – Revenue and Forecast to 2028 (US$ Million)
- Collins Aerospace
- Data Device Corporation
- Fujikura Ltd.
- HUBER+SUHNER
- Nexans
- TE Connectivity Corporation
- Save and reduce time carrying out entry-level research by identifying the growth, size, leading players, and segments in the SAM data bus market.
- Highlights key business priorities in order to assist companies to realign their business strategies
- The key findings and recommendations highlight crucial progressive industry trends in the SAM data bus market, thereby allowing players across the value chain to develop effective long-term strategies
- Develop/modify business expansion plans by using substantial growth offering developed and emerging markets
- Scrutinize in-depth SAM market trends and outlook coupled with the factors driving the data bus market, as well as those hindering it
- Enhance the decision-making process by understanding the strategies that underpin commercial interest with respect to client products, segmentation, pricing, and distribution