North America Well Completion Equipment and Services Market Forecast to 2028 – COVID-19 Impact and Analysis - by Offerings (Equipment and Service) and Location (Onshore and Offshore)
Market Introduction
The well completion market in North America is sub segmented into the US, Canada, and Mexico. The region dominates the completion equipment and services market due to the presence of large continuous and large oil & gas exploration and production projects as well as a surge in new activities in the US, the Gulf of Mexico, and Canada. The US is the largest contributor to the total oil & gas production of North America. An increase in the number of horizontal wells in the US along with a rise in oil and shale gas production per rig are the key factors contributing to the well completion market growth in the country. In 2020, the country reported oil production of 23,521 barrels/day, and crude oil and condensate production of 17,489 barrels/day; there were 7,394 oil and gas well completions in the US in that year. The emergence of advance intelligent well completion systems such as high-end self-adaptive inflow control completion systems would propel the market growth in North America. Moreover, high demand for onshore equipment due to significant prospects in the Permian Basin and North Dakota, especially in an increasingly large number of unconventional projects, would flourish the well completion market growth for the onshore segment. Halliburton (US), Schlumberger Limited (US), and Baker Hughes Company (US) are among the key completion equipment and services providers in the region. Furthermore, oil & gas companies such as Royal Dutch Shell (Netherlands) are creating opportunities for investments in the crude oil industry in the US and Canada.
The COVID-19 pandemic led to reduced activities in the oil & gas power-generating facilities, as well as shutting down of construction, operations, and maintenance projects at several locations after issuing multiple "stay at home" orders by state governors across the countries. Across the energy industry, these quarantine measures and shutdowns caused furloughs and layoffs of technical, construction, and manufacturing personnel, as well as project demobilizations in many cases. As a result, many oil wells were struggling to keep up with maintenance and operations. Furthermore, the COVID-19 pandemic has made it more difficult for oil and gas producers to get project finance or equity capital. As a result, the COVID-19 pandemic had a detrimental influence on the North American well completion equipment and services industry
Get more information on this report :
Market Overview and Dynamics
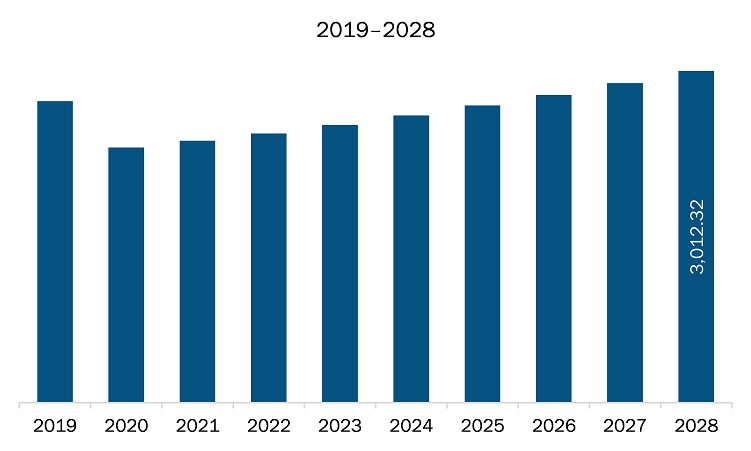
The well completion equipment and services market in North America is expected to grow from US$ 2,377.24 million in 2021 to US$ 3,012.32 million by 2028; it is estimated to grow at a CAGR of 3.4% from 2021 to 2028. Adoption of smart well technologies; the automation in well technologies is one of the major factors aiding the growth of the market across the region. The adoption of smart well technologies has become a popular trend among well rig vendors. It provides different advantages such as an increase in production rates, time and cost savings, a decrease in water injections, and monitoring of the whole production operations, along with real-time updates to the connected monitor or devices. Initially, the smart well concept was tried in onshore wells but now it has been applied to the offshore rigs as well. Moreover, industrial revolution 4.0 in the oil & gas industry has propelled the adoption of smart well technologies and well completion equipment across different oil rigs, which is driving the market. The intelligent well completion system also helps to boost the oil production and overall operational efficiency to 50% and more (if retained successfully). Thereby, adoption of smart well technologies is expected to fuel the North America well completion equipment and services market growth. This is bolstering the growth of the well completion equipment and services market.
Key Market Segments
Based on the offerings, the well completion equipment and services market are segmented into equipment and services. In 2020, the services segment held the largest share North America well completion equipment and services market. Based on equipment, the market is divided into packers, sand control tools, multistage fracturing tools, liner hangers, smart wells, valves, control devices, and others. In 2020, the packers segment held the largest share North America well completion equipment and services market. Based on location, the well completion equipment and services market is segmented into onshore and offshore. The onshore segment accounts for largest market share in the 2020.
Major Sources and Companies Listed
A few major primary and secondary sources referred to for preparing this report on the well completion equipment and services market in North America are company websites, annual reports, financial reports, national government documents, and statistical database, among others. Major companies listed in the report are Baker Hughes Company; FTS International; Halliburton Company; Nov Inc.; NCS Multistage, LLC; Royal Dutch Shell PLC; RPC Incorporated; Schlumberger Limited; Nine Energy Services; and Welltec among others.
Reasons to buy report
- To understand the North America well completion equipment and services market landscape and identify market segments that are most likely to guarantee a strong return
- Stay ahead of the race by comprehending the ever-changing competitive landscape for North America well completion equipment and services market
- Efficiently plan M&A and partnership deals in North America well completion equipment and services market by identifying market segments with the most promising probable sales
- Helps to take knowledgeable business decisions from perceptive and comprehensive analysis of market performance of various segment form North America well completion equipment and services market
- Obtain market revenue forecast for market by various segments from 2021-2028 in North America region.
NORTH AMERICA WELL COMPLETION EQUIPMENT AND SERVICES MARKET SEGMENTATION
By Offerings
- Equipment
- Packers
- Sand Control Tools
- Multistage Fracturing Tools
- Liner Hangers
- Smart Wells
- Valves
- Control Devices
- Others
- Services
By Location
- Onshore
- Offshore
By Country
- US
- Canada
- Mexico
Company Profiles
- Baker Hughes Company
- FTS International
- Halliburton Company
- Nov Inc.
- NCS Multistage, LLC
- Royal Dutch Shell PLC
- RPC Incorporated
- Schlumberger Limited
- Nine Energy Services
- Welltec
TABLE OF CONTENTS
1. Introduction
1.1 Study of the Scope
1.2 The Insight Partners Research Report Guidance
1.3 Market Segmentation
2. Key Takeaways
3. Research Methodology
3.1 Coverage
3.2 Secondary Research
3.3 Primary Research
4. North America Well Completion Equipment and Services Market Landscape
4.1 Market Overview
4.2 PEST Analysis
4.2.1 North America
4.3 Ecosystem Analysis
4.4 Expert Opinions
5. North America Well Completion Equipment and Services Market – Key Market Dynamics
5.1 Market Drivers
5.1.1 Rise in Demand for Oil & Gas Exploration
5.1.2 Resumption of Shale Gas Operations
5.2 Market Restraints
5.2.1 Downfall in the Oil & Gas Industry in FY 2020
5.3 Future Trends
5.3.1 Exploration Projects and Collaboration of Oil Service Vendors
5.4 Market Opportunities
5.4.1 Adoption of Smart Well Technologies
5.5 Impact Analysis of Drivers and Restraints
6. Well Completion Equipment and Services – North America Market Analysis
6.1 North America Well Completion Equipment and Services Market Overview
6.2 North America Well Completion Equipment and Services Market Revenue Forecast and Analysis
7. North America Well Completion Equipment and Services Market – By Offerings
7.1 Overview
7.2 North America Well Completion Equipment and Services Market, By Offerings (2020 and 2028)
7.3 Equipment
7.3.1 Overview
7.3.2 Equipment: North America Well Completion Equipment and Services Market – Revenue and Forecast to 2028 (US$ Million)
7.3.2.1 Packers
7.3.2.1.1 Overview
7.3.2.1.2 Packers: North America Well Completion Equipment and Services Market – Revenue and Forecast to 2028 (US$ Million)
7.3.2.2 Sand Control Tools
7.3.2.2.1 Overview
7.3.2.2.2 Sand Control Tools: North America Well Completion Equipment and Services Market – Revenue and Forecast to 2028 (US$ Million)
7.3.2.3 Multistage Fracturing Tools
7.3.2.3.1 Overview
7.3.2.3.2 Multistage Fracturing Tools: North America Well Completion Equipment and Services Market – Revenue and Forecast to 2028 (US$ Million)
7.3.2.4 Liner Hangers
7.3.2.4.1 Overview
7.3.2.4.2 Liner Hangers: North America Well Completion Equipment and Services Market – Revenue and Forecast to 2028 (US$ Million)
7.3.2.5 Smart Wells
7.3.2.5.1 Overview
7.3.2.5.2 Smart Wells: North America Well Completion Equipment and Services Market – Revenue and Forecast to 2028 (US$ Million)
7.3.2.6 Valves
7.3.2.6.1 Overview
7.3.2.6.2 Valves: North America Well Completion Equipment and Services Market – Revenue and Forecast to 2028 (US$ Million)
7.3.2.7 Control Devices
7.3.2.7.1 Overview
7.3.2.7.2 Control Devices: North America Well Completion Equipment and Services Market – Revenue and Forecast to 2028 (US$ Million)
7.3.2.8 Others
7.3.2.8.1 Overview
7.3.2.8.2 Others: North America Well Completion Equipment and Services Market – Revenue and Forecast to 2028 (US$ Million)
7.4 Services
7.4.1 Overview
7.4.2 Services: North America Well Completion Equipment and Services Market – Revenue and Forecast to 2028 (US$ Million)
8. North America Well Completion Equipment and Services Market – By Location
8.1 Overview
8.2 North America Well Completion Equipment and Services Market, by Location (2020 and 2028)
8.3 Onshore
8.3.1 Overview
8.3.2 Onshore: North America Well Completion Equipment and Services Market – Revenue and Forecast to 2028 (US$ Million)
8.4 Offshore
8.4.1 Overview
8.4.2 Offshore: North America Well Completion Equipment and Services Market – Revenue and Forecast to 2028 (US$ Million)
9. North America Well Completion Equipment and Services Market – Country Analysis
9.1 North America: Well Completion Equipment and Services Market
9.1.1 North America: Well Completion Equipment and Services Market- by Key Country
9.1.1.1 US: Well Completion Equipment and Services Market – Revenue and Forecast to 2028 (US$ Million)
9.1.1.1.1 US: Well Completion Equipment and Services Market- by Offerings
9.1.1.1.2 US: Well Completion Equipment and Services Market- by Location
9.1.1.2 Canada: Well Completion Equipment and Services Market – Revenue and Forecast to 2028 (US$ Million)
9.1.1.2.1 Canada: Well Completion Equipment and Services Market- by Offerings
9.1.1.2.2 Canada: Well Completion Equipment and Services Market- by Location
9.1.1.3 Mexico: Well Completion Equipment and Services Market – Revenue and Forecast to 2028 (US$ Million)
9.1.1.3.1 Mexico: Well Completion Equipment and Services Market- by Offerings
9.1.1.3.2 Mexico: Well Completion Equipment and Services Market- by Location
10. North America Well Completion Equipment and Services Market - COVID-19 Impact Analysis
10.1 North America
11. North America Well Completion Market-Industry Landscape
11.1 Overview
11.2 Market Initiative
11.3 Merger and Acquisition
11.4 New Product Launch
12. Company Profiles
12.1 Baker Hughes Company
12.1.1 Key Facts
12.1.2 Business Description
12.1.3 Products and Services
12.1.4 Financial Overview
12.1.5 SWOT Analysis
12.1.6 Key Developments
12.2 FTS International
12.2.1 Key Facts
12.2.2 Business Description
12.2.3 Products and Services
12.2.4 Financial Overview
12.2.5 SWOT Analysis
12.2.6 Key Developments
12.3 Halliburton Company
12.3.1 Key Facts
12.3.2 Business Description
12.3.3 Products and Services
12.3.4 Financial Overview
12.3.5 SWOT Analysis
12.3.6 Key Developments
12.4 NOV Inc.
12.4.1 Key Facts
12.4.2 Business Description
12.4.3 Products and Services
12.4.4 Financial Overview
12.4.5 SWOT Analysis
12.4.6 Key Developments
12.5 NSC Multistage LLC
12.5.1 Key Facts
12.5.2 Business Description
12.5.3 Products and Services
12.5.4 Financial Overview
12.5.5 SWOT Analysis
12.5.6 Key Developments
12.6 Royal Dutch Shell Plc
12.6.1 Key Facts
12.6.2 Business Description
12.6.3 Products and Services
12.6.4 Financial Overview
12.6.5 SWOT Analysis
12.6.6 Key Developments
12.7 RPC Incorporated
12.7.1 Key Facts
12.7.2 Business Description
12.7.3 Products and Services
12.7.4 Financial Overview
12.7.5 SWOT Analysis
12.7.6 Key Developments
12.8 Schlumberger Limited
12.8.1 Key Facts
12.8.2 Business Description
12.8.3 Products and Services
12.8.4 Financial Overview
12.8.5 SWOT Analysis
12.8.6 Key Developments
12.9 Nine Energy Service, Inc.
12.9.1 Key Facts
12.9.2 Business Description
12.9.3 Products and Services
12.9.4 Financial Overview
12.9.5 SWOT Analysis
12.9.6 Key Developments
12.10 Welltec
12.10.1 Key Facts
12.10.2 Business Description
12.10.3 Products and Services
12.10.4 Financial Overview
12.10.5 SWOT Analysis
12.10.6 Key Developments
13. Appendix
13.1 About The Insight Partners
13.2 Word Index
LIST OF TABLES
Table 1. North America Well Completion Equipment and Services Market Revenue and Forecast to 2028 (US$ Million)
Table 2. North America: Well Completion Equipment and Services Market- by Key Country – Revenue and Forecast to 2028 (US$ Million)
Table 3. US: Well Completion Equipment and Services Market- by Offerings –Revenue and Forecast to 2028 (US$ Million)
Table 4. United States Well Completion Equipment and Services Market, by Equipment – Revenue and Forecast to 2028 (USD Million)
Table 5. US: Well Completion Equipment and Services Market- by Location –Revenue and Forecast to 2028 (US$ Million)
Table 6. Canada: Well Completion Equipment and Services Market- by Offerings –Revenue and Forecast to 2028 (US$ Million)
Table 7. Canada Well Completion Equipment and Services Market, by Equipment – Revenue and Forecast to 2028 (USD Million)
Table 8. Canada: Well Completion Equipment and Services Market- by Location –Revenue and Forecast to 2028 (US$ Million)
Table 9. Mexico: Well Completion Equipment and Services Market- by Offerings –Revenue and Forecast to 2028 (US$ Million)
Table 10. Mexico Well Completion Equipment and Services Market, by Equipment – Revenue and Forecast to 2028 (USD Million)
Table 11. Mexico: Well Completion Equipment and Services Market- by Location –Revenue and Forecast to 2028 (US$ Million)
Table 12. List of Abbreviation
LIST OF FIGURES
Figure 1. North America Well Completion Equipment and Services Market Segmentation
Figure 2. North America Well Completion Equipment and Services Market Segmentation – By Country
Figure 3. North America Well Completion Equipment and Services Market Overview
Figure 4. North America Well Completion Equipment and Services Market, by Offerings
Figure 5. North America Well Completion Equipment and Services Market, by Location
Figure 6. North America Well Completion Equipment and Services Market, by Country
Figure 7. North America PEST Analysis
Figure 8. North America Well Completion Equipment and Services Market: Impact Analysis of Drivers and Restraints
Figure 9. North America Well Completion Equipment and Services Market Revenue Forecast and Analysis (US$ Million)
Figure 10. North America Well Completion Equipment and Services Market Revenue Share, by Offerings (2020 and 2028)
Figure 11. Equipment: North America Well Completion Equipment and Services Market – Revenue and Forecast to 2028 (US$ Million)
Figure 12. Packers: North America Well Completion Equipment and Services Market – Revenue and Forecast to 2028 (US$ Million)
Figure 13. Sand Control Tools: North America Well Completion Equipment and Services Market – Revenue and Forecast to 2028 (US$ Million)
Figure 14. Multistage Fracturing Tools: North America Well Completion Equipment and Services Market – Revenue and Forecast to 2028 (US$ Million)
Figure 15. Liner Hangers: North America Well Completion Equipment and Services Market – Revenue and Forecast to 2028 (US$ Million)
Figure 16. Smart Wells: North America Well Completion Equipment and Services Market – Revenue and Forecast to 2028 (US$ Million)
Figure 17. Valves: North America Well Completion Equipment and Services Market – Revenue and Forecast to 2028 (US$ Million)
Figure 18. Control Devices: North America Well Completion Equipment and Services Market – Revenue and Forecast to 2028 (US$ Million)
Figure 19. Others: North America Well Completion Equipment and Services Market – Revenue and Forecast to 2028 (US$ Million)
Figure 20. Services: North America Well Completion Equipment and Services Market – Revenue and Forecast to 2028 (US$ Million)
Figure 21. North America Well Completion Equipment and Services Market Revenue Share, by Location (2020 and 2028)
Figure 22. Onshore: North America Well Completion Equipment and Services Market – Revenue and Forecast to 2028 (US$ Million)
Figure 23. Offshore: North America Well Completion Equipment and Services Market – Revenue and Forecast to 2028 (US$ Million)
Figure 24. North America: Well Completion Equipment and Services Market – Revenue by Country to 2028 (US$ Million)
Figure 25. North America: Well Completion Equipment and Services Market Revenue Share, by Key Country (2020 and 2028)
Figure 26. US: Well Completion Equipment and Services Market – Revenue and Forecast to 2028 (US$ Million)
Figure 27. Canada: Well Completion Equipment and Services Market – Revenue and Forecast to 2028 (US$ Million)
Figure 28. Mexico: Well Completion Equipment and Services Market – Revenue and Forecast to 2028 (US$ Million)
Figure 29. Impact of COVID-19 Pandemic in North American Country Markets
- Baker Hughes Company
- FTS International
- Halliburton Company
- Nov Inc.
- NCS Multistage, LLC
- Royal Dutch Shell PLC
- RPC Incorporated
- Schlumberger Limited
- Nine Energy Services
- Welltec
- Save and reduce time carrying out entry-level research by identifying the growth, size, leading players and segments in the North America Well Completion Equipment and Services Market.
- Highlights key business priorities in order to assist companies to realign their business strategies
- The key findings and recommendations highlight crucial progressive industry trends in the North America Well Completion Equipment and Services Market, thereby allowing players across the value chain to develop effective long-term strategies
- Develop/modify business expansion plans by using substantial growth offering developed and emerging markets
- Scrutinize in-depth North America market trends and outlook coupled with the factors driving the Well Completion Equipment and Services Market, as well as those hindering it
- Enhance the decision-making process by understanding the strategies that underpin commercial interest with respect to client products, segmentation, pricing and distribution