North America Nutritional Bars Market Forecast to 2028 – COVID-19 Impact and Regional Analysis – by Type (Protein Bars, High-Fiber Bars, and Others), by Category (Conventional, Gluten-Free), by Distribution Channel (Supermarkets & Hypermarkets, Convenience Stores, Online Retail, and Others)
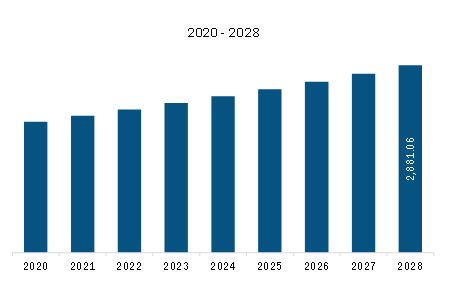
The North America nutritional bars market is expected to grow from US$ 2,200.46 million in 2022 to US$ 2,881.06 million by 2028. It is estimated to grow at a CAGR of 4.6% from 2022 to 2028.
Product Developments and Launches by Nutritional Bars Manufacturers Drive North America Nutritional Bars Market
Over the past few years, people have become more concerned about what they eat and the nutritional profile of the products they eat. Nutritional bars manufacturers are engaging in various strategic development initiatives to sustain in the market by offering innovative products to customers. For example, in 2022, LUNA, the women-centric brand by Clif Bar & Company, launched a new line of bars containing 2.5 grams of prebiotics. These are the first bars with prebiotics. Studies show that 5 grams or more of fiber-containing prebiotics can propel the development of beneficial bacteria in the gut, supporting digestive health.
In 2017, Kellogg Company acquired RXBar, a company producing clean-label protein bars made with whole food ingredients. Adding a pioneering, clean-label, high-protein snacking product to Kellogg's portfolio bolstered the company's already strong wholesome snacks offering. With a base of egg whites, fruit and nuts, each RXBar provides 12 grams of protein. They are available in 11 different flavors, with additional seasonal and limited-time varieties, which are distributed in the US. The company also recently launched RXBar Kids in kid-friendly flavors and portions, which contain the same core ingredients as RXBars. In 2020, Atkins Nutritionals, Inc. introduced Atkins Endulge Dessert Bars. These bars offer a unique texture, with a rich, creamy burst of flavors on the outside and a subtle crispiness on the inside. These keto-friendly, high-fiber treats contain 130 calories, 3 grams of carbohydrates, and 1 gram of sugar per serving. In 2022, Simply Good Foods Co., a company developing and marketing nutritional foods and snacks, expanded its Atkins and Quest brands with several new product launches. Under the Atkins brand, Simply Good Foods has introduced new Keto Peanut Butter Cups, Caramel Almond Clusters, Chocolate Crème Wafer Crisps, and Vanilla Caramel Pretzel Bar. Under the Quest brand, the company has introduced Quest Dipped Chocolate Chip Cookie Dough Protein Bars. The bars are coated with chocolate and drizzled with white chocolate. They are free of gluten and contain 3 grams of net carbohydrates, 17 grams of protein, and 1 gram of sugar per serving. They are available in three sizes: 4-count multi-packs, 1-count bars, and 12-count cartons. In 2022, Nature Valley launched Protein Crunch bars with a creamy and crunchy texture. The product contains 10 grams of protein with ingredients such as creamy peanut butter and crunchy nuts in a whole-grain oat bar. This new addition to the Nature Valley Protein lineup is ideal for between-meal cravings. In 2022, Kellogg's Special K introduced new Protein Snack Bars, with 6 grams of protein and 90 calories per bar. These are available in two flavors: sweet berry vanilla and rich chocolatey brownie sundae. These new Special K Protein Snack Bars can be carried as an easy, on-the-go protein snack. Such product launches attract consumers to choose from a wide range of nutritional bars, which is eventually bolstering the growth of the North America nutritional bars market.
North America Nutritional Bars Market Overview
The North America nutritional bars market growth is attributed to the rising preference for on-the-go snacking, meal replacement, functional food, and indulgence. Consumers looked for healthier alternatives with high nutritional value in food and beverages to boost immunity during the COVID-19 pandemic. The rising demand for nutritional bars, including protein bars, high-fiber bars, and meal replacement bars, from young adults and athletes, is also driving the market growth in this region. These nutritional bars enhance the performance and stamina of athletes and fitness lifestyle users. Further, the growing number of health and fitness-conscious individuals has increased the demand for functional products such as nutritional bars. According to the US Bureau of Labor Statistics, average daily participation rates in sports and exercise grew by 3.6% between 2003 and 2015. An increasing number of sports participants in the US is likely to boost the demand for energy bars in North America during the forecast period. Also, the popularity of sugar-free, gluten-free, and low-carb nutritional bars is growing across the region.
Moreover, the rising vegan population and veganism are boosting the demand for plant-based nutritional bars. Thus, leading manufacturers are launching plant-based nutritional bars to cater to consumers’ demands. For instance, in June 2020, RXBAR, a Kellogg subsidiary, launched its first plant-based nutritional bar. This bar contains 10g of plant protein obtained from peas and almonds. Such product innovations by manufacturers are expected to boost the North America nutritional bars market growth during the forecast period.
North America Nutritional Bars Market Revenue and Forecast to 2028 (US$ Million)
The North America nutritional bars market is segmented into type, category, distribution channel, and country.
Based on type, the North America nutritional bars market is segmented into protein bars, high-fiber bars, and others. In 2022, the protein bars segment registered a largest share in the North America nutritional bars market.
Based on category, the North America nutritional bars market is bifurcated into conventional and gluten-free. In 2022, the conventional segment registered a larger share in the North America nutritional bars market.
Based on distribution channel, the North America nutritional bars market is segmented into supermarkets & hypermarkets, convenience stores, online retail, and others. In 2022, the supermarkets & hypermarkets segment registered a largest share in the North America nutritional bars market.
Based on country, the North America nutritional bars market is segmented into the US, Canada, and Mexico. In 2022, the US segment registered a largest share in the North America nutritional bars market.
Clif Bar & Co; General Mills Inc; Kind LLC; Mars Inc; Perfect Bar LLC; Premier Nutrition Co LLC; Rise Bar Inc; The Kellogg Co; The Quaker Oats Co; and The Simply Good Foods Co are the leading companies operating in the North America nutritional bars market.
1. Introduction
1.1 Study Scope
1.2 The Insight Partners Research Report Guidance
1.3 Market Segmentation
2. Key Takeaways
3. Research Methodology
3.1 Scope of the Study
3.2 Research Methodology
3.2.1 Data Collection:
3.2.2 Primary Interviews:
3.2.3 Hypothesis Formulation:
3.2.4 Macro-economic Factor Analysis:
3.2.5 Developing Base Number:
3.2.6 Data Triangulation:
3.2.7 Country Level Data:
4. North America Nutritional Bars Market Overview
4.1 Market Overview
4.2 North America PEST Analysis
4.3 Expert Opinion
5. North America Nutritional Bars Market – Key Market Dynamics
5.1 Market Drivers
5.1.1 Growing Preference for Healthy Snacking Among Millennials
5.1.2 Product Developments and Launches by Nutritional Bars Manufacturers
5.2 Market Restraints
5.2.1 Availability of Substitutes
5.3 Market Opportunities
5.3.1 Inclusion of Functional Claims on Labels
5.4 Future Trends
5.4.1 Rising Fitness Trends
5.5 Impact Analysis of Drivers and Restraints
6. Nutritional Bars – North America Market Analysis
6.1 North America Nutritional Bars Market Overview
6.2 North America Nutritional Bars Market –Revenue and Forecast to 2028 (US$ Million)
7. North America Nutritional Bars Analysis – By Type
7.1 Overview
7.2 North America Nutritional Bars Market, By Type (2021 and 2028)
7.3 Protein Bars
7.3.1 Overview
7.3.2 Protein Bars: North America Nutritional Bars Market – Revenue and Forecast to 2028 (US$ Million)
7.4 High-Fiber Bars
7.4.1 Overview
7.4.2 High-Fiber Bars: North America Nutritional Bars Market – Revenue and Forecast to 2028 (US$ Million)
7.5 Others
7.5.1 Overview
7.5.2 Others: North America Nutritional Bars Market – Revenue and Forecast to 2028 (US$ Million)
8. North America Nutritional Bars Market Analysis – By Category
8.1 Overview
8.2 North America Nutritional Bars Market, By Category (2021 and 2028)
8.3 Conventional
8.3.1 Overview
8.3.2 Conventional: North America Nutritional Bars Market – Revenue and Forecast to 2028 (US$ Million)
8.4 Gluten-Free
8.4.1 Overview
8.4.2 Gluten-Free: North America Nutritional Bars Market – Revenue and Forecast to 2028 (US$ Million)
9. North America Nutritional Bars Analysis – By Distribution Channel
9.1 Overview
9.2 North America Nutritional Bars Market, By Distribution Channel (2021 and 2028)
9.3 Supermarkets and Hypermarkets
9.3.1 Overview
9.3.2 Supermarkets and Hypermarkets: North America Nutritional Bars Market – Revenue and Forecast to 2028 (US$ Million)
9.4 Convenience Stores
9.4.1 Overview
9.4.2 Convenience Stores: North America Nutritional Bars Market – Revenue and Forecast to 2028 (US$ Million)
9.5 Online Retail
9.5.1 Overview
9.5.2 Online Retail: North America Nutritional Bars Market – Revenue and Forecast to 2028 (US$ Million)
9.6 Others
9.6.1 Overview
9.6.2 Others: North America Nutritional Bars Market – Revenue and Forecast to 2028 (US$ Million)
10. North America Nutritional Bars Market – Country Analysis
10.1 Overview
10.1.1 North America: Nutritional Bars Market, by Key Country
10.1.1.1 US: Nutritional Bars Market – Revenue and Forecast to 2028 (US$ Million)
10.1.1.1.1 US: Nutritional Bars Market, By Type
10.1.1.1.2 US: Nutritional Bars Market, by Category
10.1.1.1.3 US: Nutritional Bars Market, by Distribution Channel
10.1.1.2 Canada: Nutritional Bars Market – Revenue and Forecast to 2028 (US$ Million)
10.1.1.2.1 Canada: Nutritional Bars Market, By Type
10.1.1.2.2 Canada: Nutritional Bars Market, by Category
10.1.1.2.3 Canada: Nutritional Bars Market, by Distribution Channel
10.1.1.3 Mexico: Nutritional Bars Market – Revenue and Forecast to 2028 (US$ Million)
10.1.1.3.1 Mexico: Nutritional Bars Market, By Type
10.1.1.3.2 Mexico: Nutritional Bars Market, by Category
10.1.1.3.3 Mexico: Nutritional Bars Market, by Distribution Channel
11. Industry Landscape
11.1 Overview
11.2 Product launch
12. Company Profiles
12.1 The Simply Good Foods Co
12.1.1 Key Facts
12.1.2 Business Description
12.1.3 Products and Services
12.1.4 Financial Overview
12.1.5 SWOT Analysis
12.1.6 Key Developments
12.2 Clif Bar & Co
12.2.1 Key Facts
12.2.2 Business Description
12.2.3 Products and Services
12.2.4 Financial Overview
12.2.5 SWOT Analysis
12.2.6 Key Developments
12.3 General Mills Inc
12.3.1 Key Facts
12.3.2 Business Description
12.3.3 Products and Services
12.3.4 Financial Overview
12.3.5 SWOT Analysis
12.3.6 Key Developments
12.4 The Kellogg Co
12.4.1 Key Facts
12.4.2 Business Description
12.4.3 Products and Services
12.4.4 Financial Overview
12.4.5 SWOT Analysis
12.4.6 Key Developments
12.5 Rise Bar Inc
12.5.1 Key Facts
12.5.2 Business Description
12.5.3 Products and Services
12.5.4 Financial Overview
12.5.5 SWOT Analysis
12.5.6 Key Developments
12.6 The Quaker Oats Co
12.6.1 Key Facts
12.6.2 Business Description
12.6.3 Products and Services
12.6.4 Financial Overview
12.6.5 SWOT Analysis
12.6.6 Key Developments
12.7 Perfect Bar LLC
12.7.1 Key Facts
12.7.2 Business Description
12.7.3 Products and Services
12.7.4 Financial Overview
12.7.5 SWOT Analysis
12.7.6 Key Developments
12.8 Mars Inc
12.8.1 Key Facts
12.8.2 Business Description
12.8.3 Products and Services
12.8.4 Financial Overview
12.8.5 SWOT Analysis
12.8.6 Key Developments
12.9 Kind LLC
12.9.1 Key Facts
12.9.2 Business Description
12.9.3 Products and Services
12.9.4 Financial Overview
12.9.5 SWOT Analysis
12.9.6 Key Developments
12.10 Premier Nutrition Co LLC
12.10.1 Key Facts
12.10.2 Business Description
12.10.3 Products and Services
12.10.4 Financial Overview
12.10.5 SWOT Analysis
12.10.6 Key Developments
13. Appendix
13.1 About The Insight Partners
13.2 Word Index
LIST OF TABLES
Table 1. North America Nutritional Bars Market –Revenue and Forecast to 2028 (US$ Million)
Table 2. US Nutritional Bars Market, Type – Revenue and Forecast to 2028 (US$ Million)
Table 3. US Nutritional Bars Market, by Category – Revenue and Forecast to 2028 (US$ Million)
Table 4. US Nutritional Bars Market, by Distribution Channel – Revenue and Forecast to 2028 (US$ Million)
Table 5. Canada Nutritional Bars Market, By Type – Revenue and Forecast to 2028 (US$ Million)
Table 6. Canada Nutritional Bars Market, by Category – Revenue and Forecast to 2028 (US$ Million)
Table 7. Canada Nutritional Bars Market, by Distribution Channel – Revenue and Forecast to 2028 (US$ Million)
Table 8. Mexico Nutritional Bars Market, By Type – Revenue and Forecast to 2028 (US$ Million)
Table 9. Mexico Nutritional Bars Market, by Category – Revenue and Forecast to 2028 (US$ Million)
Table 10. Mexico Nutritional Bars Market, by Distribution Channel – Revenue and Forecast to 2028 (US$ Million)
Table 11. List of Abbreviation
LIST OF FIGURES
Figure 1. North America Nutritional Bars Market Segmentation
Figure 2. North America Nutritional Bars Market Segmentation – By Country
Figure 3. North America Nutritional Bars Market Overview
Figure 4. North America Nutritional Bars Market: By Category
Figure 5. North America Nutritional Bars Market: By Country
Figure 6. North America: PEST Analysis
Figure 7. Expert Opinion
Figure 8. North America Nutritional Bars Market Impact Analysis of Drivers and Restraints
Figure 9. North America: Nutritional Bars Market – Revenue and Forecast to 2028 (US$ Million)
Figure 10. North America Nutritional Bars Market Revenue Share, By Type (2021 and 2028)
Figure 11. Protein Bars: North America Nutritional Bars Market – Revenue and Forecast To 2028 (US$ Million)
Figure 12. High-Fiber Bars: North America Nutritional Bars Market – Revenue and Forecast To 2028 (US$ Million)
Figure 13. Others: North America Nutritional Bars Market – Revenue and Forecast To 2028 (US$ Million)
Figure 14. North America Nutritional Bars Market Revenue Share, By Category (2021 and 2028)
Figure 15. Conventional: North America Nutritional Bars Market – Revenue and Forecast To 2028 (US$ Million)
Figure 16. Gluten-Free: North America Nutritional Bars Market – Revenue and Forecast To 2028 (US$ Million)
Figure 17. North America Nutritional Bars Market Revenue Share, By Distribution Channel (2021 and 2028)
Figure 18. Supermarkets and Hypermarkets: North America Nutritional Bars Market – Revenue and Forecast To 2028 (US$ Million)
Figure 19. Convenience Stores: North America Nutritional Bars Market – Revenue and Forecast To 2028 (US$ Million)
Figure 20. Online Retail: North America Nutritional Bars Market – Revenue and Forecast To 2028 (US$ Million)
Figure 21. Others: North America Nutritional Bars Market – Revenue and Forecast To 2028 (US$ Million)
Figure 22. North America: Nutritional Bars Market, by Key Country— Revenue (2021)
Figure 23. North America: Nutritional Bars Market Revenue Share, by Key Country (2021 and 2028)
Figure 24. US: Nutritional Bars Market – Revenue and Forecast to 2028 (US$ Million)
Figure 25. Canada: Nutritional Bars Market – Revenue and Forecast to 2028 (US$ Million)
Figure 26. Mexico: Nutritional Bars Market – Revenue and Forecast to 2028 (US$ Million)
- Clif Bar & Co
- General Mills Inc
- Kind LLC
- Mars Inc
- Perfect Bar LLC
- Premier Nutrition Co LLC
- Rise Bar Inc
- The Kellogg Co
- The Quaker Oats Co
- The Simply Good Foods Co
- Save and reduce time carrying out entry-level research by identifying the growth, size, leading players, and segments in the North America nutritional bars market.
- Highlights key business priorities in order to assist companies to realign their business strategies
- The key findings and recommendations highlight crucial progressive industry trends in the North America nutritional bars market, thereby allowing players across the value chain to develop effective long-term strategies
- Develop/modify business expansion plans by using substantial growth offering developed and emerging markets
- Scrutinize in-depth North America market trends and outlook coupled with the factors driving the nutritional bars market, as well as those hindering it
- Enhance the decision-making process by understanding the strategies that underpin commercial interest with respect to client products, segmentation, pricing, and distribution.