North America Automated Cell Counters Market Forecast to 2028 – COVID-19 Impact and Regional Analysis – by Type (Hemocytometer, Flow Cytometers, Electrical Impedance Coulter Counters, and Spectrophotometers) and End User (Hospitals, Research Laboratories, Diagnostics Centers, and Others)
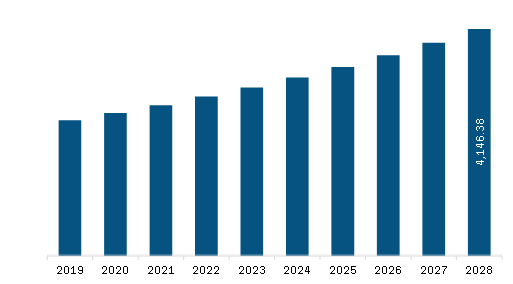
The automated cell counters market in North America is expected to grow from US$ 2,908.97 million in 2022 to US$ 4,146.38 million by 2028; it is estimated to grow at a CAGR of 6.1% from 2022 to 2028.
Increase in Drug Discovery Activities
The biotechnology & biopharmaceutical industry is focusing on the discovery and development of drugs to treat various diseases. Cell and molecular biology have become crucial parts of the modern drug discovery process. Monitoring the interaction of cells and internal cellular activity provides critical information on cell health, changes in disease states, and the response of targets to potential therapeutic compounds. The ability to visualize biological activities at a cellular level has been a major element in drug discovery. Further, the addition of automation and high-volume screening methods allowed the testing of many compounds. Monitoring the effect of various compounds against a specific type of cancer is executed on a cellular level. For instance, automated cell counters are used to monitor the changes in cancer cell characteristics at every stage of cancer. Moreover, various webinars are held to create awareness about the techniques that are used for cell imaging and cell counting by various institutes. For instance, the ATA Scientific Instruments, in October 2020, held four new webinars that were specifically focused on cell counting and imaging for drug discovery. Thus, the increase in the discovery and development of drugs is boosting the demand for automated cell counters.
Market Overview
The North America automated cell counter market is segmented into the US, Canada, and Mexico. The market growth is attributed to the rising prevalence of chronic and infectious diseases; the growing research on cancer, biomedical, and stem cells; and a surge in government-initiated R&D activities. According to the U.S. Department of Health and Human Services, Healthy People 2030 is creating awareness on increasing preventive care for all age group. Children, adults, and elders are educated to do regular screenings, routine health check-ups, and blood tests. Thus, the government initiatives for preventive health care are expected increase the automated cell counter market in the United States.
North America Automated Cell Counters Market Revenue and Forecast to 2028 (US$ Million)
North America Automated Cell Counters Market Segmentation
The North America automated cell counters market is segmented on the basis of type, end user, and country. Based on type, the market is segmented into hemocytometer, flow cytometers, electrical impedance coulter counters, and spectrophotometers. The spectrophotometers segment held the largest market share in 2022. Based on end user, the market is categorized into hospitals, research laboratories, diagnostics centers, and others. The hospitals segment held the largest market share in 2022. Based on country, the market is segmented into the US, Canada, and Mexico. The US dominated the market share in 2022.
Eppendorf; Thermo Fisher Scientific Inc.; Countstar Inc.; Bio-Rad Laboratories, Inc.; F. Hoffman-La Roche Ltd; Chemometec A/S; ALIGNED GENETICS; Beckman Coulter, Inc. (Danaher); Nanoentek; Olympus Corporation; MERCK KGaA; Sysmex Corporation; Agilent Technologies, Inc.; Abbott; and Nexcelom Bioscience LLC. are the leading companies operating in the North America automated cell counters market.
1. Introduction
1.1 Study Scope
1.2 The Insight Partners Research Report Guidance
1.3 Market Segmentation
1.3.1 North America Automated Cell Counters Market – By Type
1.3.2 North America Automated Cell Counters Market – By End User
1.3.3 North America Automated Cell Counters Market – By Country
2. Automated Cell Counters Market – Key Takeaways
3. Research Methodology
3.1 Coverage
3.2 Secondary Research
3.3 Primary Research
4. North America Automated Cell Counters Market – Market Landscape
4.1 Overview
4.2 PEST Analysis
4.2.1 North America PEST Analysis
4.3 Experts Opinion
5. North America Automated Cell Counters Market – Key Market Dynamics
5.1 Market Drivers
5.1.1 Prevalence of Infectious and Chronic Diseases
5.1.2 Increase in Drug Discovery Activities
5.2 Market Restraints
5.2.1 Lack of Skilled Workforce and High Cost of Instrument
5.3 Market Opportunities
5.3.1 Use of Cell Counters in Personalized Medicine
5.4 Future Trends
5.4.1 Advancements in Automated Cell Counters
5.5 Impact Analysis
6. Automated Cell Counters Market – North America Analysis
6.1 North America Automated Cell Counters Market Revenue Forecast & Analysis
7. North America Automated Cell Counter Market – by Type
7.1 Overview
7.2 North America by Type: Market Revenue and Forecast Analysis (US$ Million)
7.3 Spectrophotometers
7.3.1 Overview
7.3.2 Spectrophotometers Market Revenue and Forecast to 2028 (US$ Million)
7.4 Flow Cytometers
7.4.1 Overview
7.4.2 Flow Cytometers Market Revenue and Forecast to 2028 (US$ Million)
7.5 Hemocytometers
7.5.1 Overview
7.5.2 Hemocytometers Market Revenue and Forecast to 2028 (US$ Million)
7.6 Electrical Impedance Coulter Counters
7.6.1 Overview
7.6.2 Electrical Impedance Coulter Counters Market Revenue and Forecast to 2028 (US$ Million)
8. North America Automated Cell Counter Market – by End User
8.1 North America Automated Cell Counter Market Revenue Share, by End User (2022 and 2028)
8.2 Hospitals
8.2.1 Overview
8.2.2 Hospitals: Automated Cell Counter Market – Revenue and Forecast to 2028 (US$ Million)
8.3 Research Laboratories
8.3.1 Overview
8.3.2 Research Laboratories: Automated Cell Counter Market – Revenue and Forecast to 2028 (US$ Million)
8.4 Diagnostic Centers
8.4.1 Overview
8.4.2 Diagnostic Centers: Automated Cell Counter Market – Revenue and Forecast to 2028 (US$ Million)
8.5 Others
8.5.1 Overview
8.5.2 Others: Automated Cell Counter Market – Revenue and Forecast to 2028 (US$ Million)
9. North America Automated Cell Counters Market – By Country Analysis
9.1 North America: Automated cell counter Market
9.1.1 Overview
9.1.2 North America: Automated Cell Counters Market, by Country, 2022 & 2028 (%)
9.1.2.1 United States: Automated Cell Counter Market – Revenue and Forecast to 2028 (US$ Million)
9.1.2.1.1 Overview
9.1.2.1.2 United States: Automated Cell Counters Market – Revenue and Forecast to 2028 (US$ Million)
9.1.2.1.3 United States: Automated Cell Counters Market, by Type, 2019–2028 (US$ Million)
9.1.2.1.4 United States: Automated Cell Counters Market, by End user, 2019–2028 (US$ Million)
9.1.2.2 Canada: Automated Cell Counters Market – Revenue and Forecast to 2028 (US$ Million)
9.1.2.2.1 Canada: Automated Cell Counters Market – Revenue and Forecast to 2028 (US$ Million)
9.1.2.2.2 Canada: Automated Cell Counters Market, by Type, 2019–2028 (US$ Million)
9.1.2.2.3 Canada: Automated Cell Counters Market, by End user, 2019–2028 (US$ Million)
9.1.2.3 Mexico: Automated Cell Counters Market – Revenue and Forecast to 2028 (US$ Million)
9.1.2.3.1 Mexico: Automated Cell Counters Market – Revenue and Forecast to 2028 (US$ Million)
9.1.2.3.2 Mexico: Automated Cell Counters Market, by Type, 2019–2028 (US$ Million)
9.1.2.3.3 Mexico: Automated Cell Counters Market, by End user, 2019–2028 (US$ Million)
10. Automated Cell Counters Market – Industry Landscape
10.1 Overview
10.2 Growth Strategies in the Automated Cell Counters Market, 2022-2028
10.3 Inorganic Growth Strategies
10.3.1 Overview
10.4 Organic Growth Strategies
10.4.1 Overview
11. COMPANY PROFILES
11.1 Eppendorf
11.1.1 Key Facts
11.1.2 Business Description
11.1.3 Products and Services
11.1.4 Financial Overview
11.1.5 SWOT Analysis
11.1.6 Key Developments
11.2 Thermo Fisher Scientific Inc.
11.2.1 Key Facts
11.2.2 Business Description
11.2.3 Products and Services
11.2.4 Financial Overview
11.2.5 SWOT Analysis
11.2.6 Key Developments
11.3 Countstar Inc.
11.3.1 Key Facts
11.3.2 Business Description
11.3.3 Products and Services
11.3.4 Financial Overview
11.3.5 SWOT Analysis
11.3.6 Key Developments
11.4 Bio-Rad Laboratories, Inc.
11.4.1 Key Facts
11.4.2 Business Description
11.4.3 Products and Services
11.4.4 Financial Overview
11.4.5 SWOT Analysis
11.4.6 Key Developments
11.5 F. Hoffmann-La Roche Ltd
11.5.1 Key Facts
11.5.2 Business Description
11.5.3 Products and Services
11.5.4 Financial Overview
11.5.5 SWOT Analysis
11.5.6 Key Developments
11.6 Chemometec A/S
11.6.1 Key Facts
11.6.2 Business Description
11.6.3 Products and Services
11.6.4 Financial Overview
11.6.5 SWOT Analysis
11.6.6 Key Developments
11.7 ALIGNEDGENETICS
11.7.1 Key Facts
11.7.2 Business Description
11.7.3 Products and Services
11.7.4 Financial Overview
11.7.5 SWOT Analysis
11.7.6 Key Developments
11.8 Beckman Coulter, Inc. (Danaher)
11.8.1 Key Facts
11.8.2 Business Description
11.8.3 Products and Services
11.8.4 Financial Overview
11.8.5 SWOT Analysis
11.8.6 Key Developments
11.9 Nanoentek
11.9.1 Key Facts
11.9.2 Business Description
11.9.3 Products and Services
11.9.4 Financial Overview
11.9.5 SWOT Analysis
11.9.6 Key Developments
11.10 Olympus Corporation
11.10.1 Key Facts
11.10.2 Business Description
11.10.3 Products and Services
11.10.4 Financial Overview
11.10.5 SWOT Analysis
11.10.6 Key Developments
11.11 MERCK KGaA
11.11.1 Key Facts
11.11.2 Business Description
11.11.3 Products and Services
11.11.4 Financial Overview
11.11.5 SWOT Analysis
11.11.6 Key Developments
11.12 Sysmex Corporation
11.12.1 Key Facts
11.12.2 Business Description
11.12.3 Products and Services
11.12.4 Financial Overview
11.12.5 SWOT Analysis
11.12.6 Key Developments
11.13 Agilent Technologies, Inc.
11.13.1 Key Facts
11.13.2 Business Description
11.13.3 Products and Services
11.13.4 Financial Overview
11.13.5 SWOT Analysis
11.13.6 Key Developments
11.14 Abbott
11.14.1 Key Facts
11.14.2 Business Description
11.14.3 Products and Services
11.14.4 Financial Overview
11.14.5 SWOT Analysis
11.14.6 Key Developments
11.15 Nexcelom Bioscience LLC.
11.15.1 Key Facts
11.15.2 Business Description
11.15.3 Products and Services
11.15.4 Financial Overview
11.15.5 SWOT Analysis
11.15.6 Key Developments
12. Appendix
12.1 About The Insight Partners
12.2 Glossary of Terms for Automated Cell Counters Market
LIST OF TABLES
Table 1. United States Automated Cell Counters Market, by Type – Revenue and Forecast to 2028 (US$ Million)
Table 2. United States Automated Cell Counters Market, by End user – Revenue and Forecast to 2028 (US$ Million)
Table 3. Canada Automated Cell Counters Market, by Type – Revenue and Forecast to 2028 (US$ Million)
Table 4. Canada Automated Cell Counters Market, by End user – Revenue and Forecast to 2028 (US$ Million)
Table 5. Mexico Automated Cell Counters Market, by Type – Revenue and Forecast to 2028 (US$ Million)
Table 6. Mexico Automated Cell Counters Market, by End user – Revenue and Forecast to 2028 (US$ Million)
Table 7. Inorganic Growth Strategies in the Automated Cell Counters Market
Table 8. Organic Growth Strategies in the Automated Cell Counters Market
Table 9. Glossary of Terms
LIST OF FIGURES
Figure 1. North America Automated Cell Counters Market Segmentation
Figure 2. North America Automated Cell Counters Market Segmentation, by Country
Figure 3. North America Automated Cell Counters Market Overview
Figure 4. Spectrophotometers Segment Held Largest Share of Product Segment in Automated Cell Counters Market
Figure 5. US is Expected to Show Remarkable Growth During the Forecast Period
Figure 6. North America: PEST Analysis
Figure 7. North America Experts Opinion
Figure 8. North America Impact Analysis
Figure 9. North America Automated Cell Counters Market – Revenue Forecast and Analysis – 2020- 2028
Figure 10. North America by Type: Market Analysis and Forecast 2022 and 2028 (%)
Figure 11. North America Spectrophotometers Market Revenue and Forecast to 2028 (US$ Million)
Figure 12. North America Flow Cytometers Market Revenue and Forecast to 2028 (US$ Million)
Figure 13. North America Hemocytometers Market Revenue and Forecast to 2028 (US$ Million)
Figure 14. North America Electrical Impedance Coulter Counters Market Revenue and Forecast to 2028 (US$ Million)
Figure 15. North America Automated Cell Counter Market Revenue Share, by End User (2022 and 2028)
Figure 16. North America Hospitals: Automated Cell Counter Market – Revenue and Forecast to 2028 (US$ Million)
Figure 17. North America Research Laboratories: Automated Cell Counter Market – Revenue and Forecast to 2028 (US$ Million)
Figure 18. North America Diagnostic Centers: Automated Cell Counter Market – Revenue and Forecast to 2028 (US$ Million)
Figure 19. North America Others: Automated Cell Counter Market – Revenue and Forecast to 2028 (US$ Million)
Figure 20. North America: Automated Cell Counters Market, by Key Country – Revenue (2022) (US$ Million)
Figure 21. United States: Automated Cell Counters Market – Revenue and Forecast to 2028 (US$ Million)
Figure 22. Canada: Automated Cell Counters Market – Revenue and Forecast to 2028 (US$ Million)
Figure 23. Mexico: Automated Cell Counters Market – Revenue and Forecast to 2028 (US$ Million)
Figure 24. Growth Strategies in the Automated Cell Counters Market, 2022-2028
- Eppendorf
- Thermo Fisher Scientific Inc.
- Countstar Inc.
- Bio-Rad Laboratories, Inc.
- F. Hoffman-La Roche Ltd
- Chemometec A/S
- ALIGNED GENETICS
- Beckman Coulter, Inc. (Danaher)
- Nanoentek
- Olympus Corporation
- MERCK KGaA
- Sysmex Corporation
- Agilent Technologies, Inc.
- Abbott
- Nexcelom Bioscience LLC.
- Save and reduce time carrying out entry-level research by identifying the growth, size, leading players, and segments in the North America automated cell counters market.
- Highlights key business priorities in order to assist companies to realign their business strategies
- The key findings and recommendations highlight crucial progressive industry trends in the North America automated cell counters market, thereby allowing players across the value chain to develop effective long-term strategies
- Develop/modify business expansion plans by using substantial growth offering developed and emerging markets
- Scrutinize in-depth North America market trends and outlook coupled with the factors driving the North America automated cell counters market, as well as those hindering it
- Enhance the decision-making process by understanding the strategies that underpin commercial interest with respect to client products, segmentation, pricing, and distribution