Europe Quantitative Structure-Activity Relationship Market Forecast to 2027 - COVID-19 Impact and Regional Analysis By Application (Drug Discovery, Molecular Modelling, Chemical Screening, Regulatory and Decision-Making, and Others); Industry (Pharmaceuticals, Cosmetics, Environmental, and Food & Beverage)
Market Introduction
A quantitative structure-activity relationship (QSAR) is a computational or mathematical modeling approach to reveal connections between biological activities and chemical compounds' structural properties. It attempts to correlate chemical structure with an activity using statistical approaches. The QSAR models are beneficial for various purposes, including the prediction of actions of untested chemicals. Also, it helps to prioritize desired biological activities as an in-silico methodology and thus decreases the number of candidate chemicals to be tested with in vivo experiments.
Thus, the increasing adoption of modeling tools in drug discovery is expected to create a significant demand for quantitative structure-activity relationships in the coming years, which is further anticipated to drive the quantitative structure-activity relationship market.
Computational Modeling has uses in the battle against Covid-19 beyond analyzing the structure of the virus itself. French artificial intelligence start-up Exact Cure is seeking to model and predict the efficacy and pharmacokinetics of already approved drugs being studied for Covid-19. Exact Cure has started to simulate two drugs being repurposed for Covid-19 to date: anti-malarial hydroxychloroquine and lopinavir/ritonavir, a protease inhibitor combination indicated for HIV. However, the start-up is building on this work through a recent partnership with analytics company Elsevier to leverage its PharmaPendium database of US Food and Drug Administration (FDA) and European Medicines Agency (EMA) approval documents to allow state-of-the-art models for 20 drugs and the integration of more personal parameters. The initiatives of governments in the region open a window of opportunities for the firms involved in the quantitative structure-activity relationship market.
Get more information on this report :
Market Overview and Dynamics
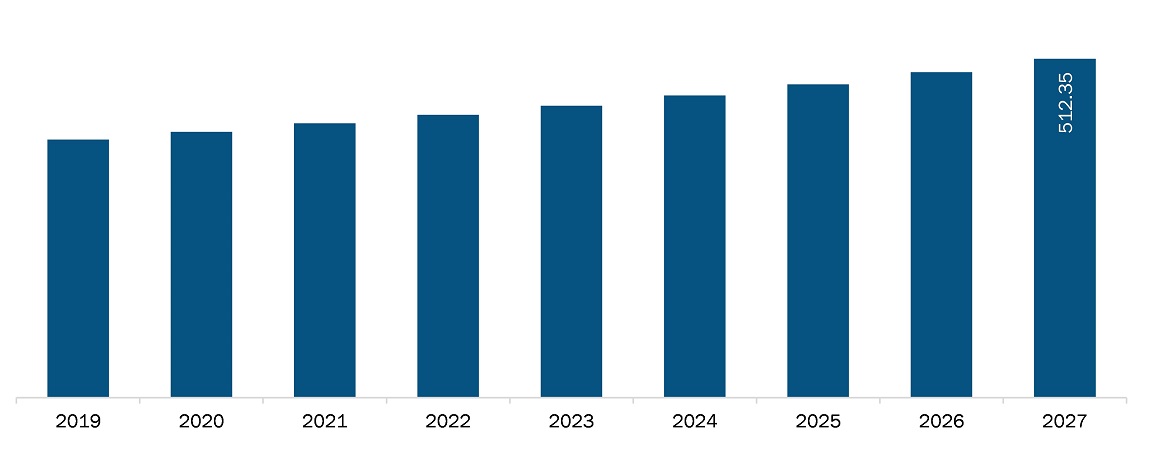
The quantitative structure-activity relationship market in Europe is expected to grow from US$ 401.9 million in 2020 to US$ 512.4 million by 2027; it is estimated to grow at a CAGR of 3.5% from 2020 to 2027. The companies engaged in drug discovery and development are adopting various business strategies to expedite discovery timelines and improve product quality. Several players in this market are focusing on collaboration with innovative biotech companies, academics, and pharmaceutical companies to enhance their respective in silico-based service portfolio and maintain a competitive edge in the industry. Majority of the pharmaceutical companies have been benefited by adopting modelling software, which, in turn is expected to propel the growth of the quantitative structure-activity relationship (QSAR) market during the forecast period. For instance, Schrodinger’s collaboration with Agios Pharmaceuticals, Inc. resulted in two FDA approved therapies with the help of computational platform.
Key Market Segments
In terms of application, the drug discovery segment accounted for the largest share of the Europe quantitative structure-activity relationship market in 2019. In terms of end user, the pharmaceuticals segment held a larger market share of the quantitative structure-activity relationship market in 2019.
Major Sources and Companies Listed
A few major primary and secondary sources referred to for preparing this report on the quantitative structure-activity relationship market in Europe are company websites, annual reports, financial reports, national government documents, and statistical database, among others. Major companies listed in the report are ProtoQSAR SL, Intertek Group Plc, Laboratory Corporation of America Holdings, Dassault Systems SE, Bibra Toxicology Advice & Consulting Ltd, and QSAR LAB SP. Z O.
Reasons to buy report
- To understand the Europe quantitative structure-activity relationship market landscape and identify market segments that are most likely to guarantee a strong return
- Stay ahead of the race by comprehending the ever-changing competitive landscape for Europe quantitative structure-activity relationship market
- Efficiently plan M&A and partnership deals in Europe quantitative structure-activity relationship market by identifying market segments with the most promising probable sales
- Helps to take knowledgeable business decisions from perceptive and comprehensive analysis of market performance of various segment form Europe quantitative structure-activity relationship market
- Obtain market revenue forecast for market by various segments from 2020-2027 in Europe region.
EUROPE QUANTITATIVE STRUCTURE-ACTIVITY RELATIONSHIP MARKET SEGMENTATION
By Application
- Drug Discovery
- Molecular Modelling
- Chemical Screening
- Regulatory and Decision-Making
- Others
By End User
- Pharmaceuticals
- Cosmetics
- Environmental
- Food and Beverage
By Country
- Europe
- Germany
- UK
- France
- Spain
- Italy
- Rest of Europe
Companies Mentioned
- ProtoQSAR SL
- Intertek Group Plc
- Dassault Systems SE
- Bibra Toxicology Advice & Consulting Ltd
- Laboratory Corporation of America Holdings
- QSAR LAB SP. Z O
1. Introduction
1.1 Scope of the Study
1.2 The Insight Partners Research Report Guidance
1.3 Market Segmentation
1.3.1 Quantitative Structure-Activity Relationship Market – By Application
1.3.2 Quantitative Structure-Activity Relationship Market – By Industry
1.3.3 Europe Quantitative Structure-Activity Relationship Market – By Country
2. Europe Quantitative Structure-Activity Relationship Market – Key Takeaways
3. Research Methodology
3.1 Coverage
3.2 Secondary Research
3.3 Primary Research
4. Europe Quantitative Structure-Activity Relationship Market – Market Landscape
4.1 Overview
4.2 PEST Analysis
4.2.1 Quantitative Structure-Activity Relationship Market- Europe PEST Analysis
4.3 Expert Opinion
5. Europe Quantitative Structure-Activity Relationship Market - Key Market Dynamics
5.1 Market Drivers
5.1.1 Increasing Adoption of Modelling Tools in Drug Discovery
5.1.2 Increasing Economic Burden of Drug Discovery
5.2 Market Restraints
5.2.1 Less Adoption in Emerging Countries
5.3 Market Opportunities
5.3.1 Market Players Initiatives
5.4 Future Trends
5.4.1 Growing Adoption of QSAR and Artificial Intelligence in Drug Discovery
5.5 Impact Analysis
6. Quantitative Structure-Activity Relationship Market – Europe Analysis
6.1 Europe Quantitative Structure-Activity Relationship Market Revenue Forecasts and Analysis
7. Europe Quantitative Structure-Activity Relationship Market Analysis And Forecasts To 2027 – By Application
7.1 Overview
7.2 Quantitative Structure-Activity Relationship (QSAR) Market, by Application, 2019 and 2027 (%)
7.3 Drug Discovery
7.3.1 Overview
7.3.2 Drug Discovery Market Revenue and Forecasts to 2027 (US$ Mn)
7.4 Molecular Modelling
7.4.1 Overview
7.4.2 Molecular Modelling Market Revenue and Forecasts to 2027 (US$ Mn)
7.5 Chemical Screening
7.5.1 Overview
7.5.2 Chemical Screening Market Revenue and Forecasts to 2027 (US$ Mn)
7.6 Regulatory and Decision-Making
7.6.1 Overview
7.6.2 Regulatory and Decision-Making Market Revenue and Forecasts to 2027 (US$ Mn)
7.7 Others
7.7.1 Overview
7.7.2 Others Market Revenue and Forecasts to 2027 (US$ Mn)
8. Europe Quantitative Structure-Activity Relationship Market Analysis And Forecasts To 2027– By Industry
8.1 Overview
8.2 Quantitative Structure-Activity Relationship (QSAR) Market, by Industry, 2019 and 2027 (%)
8.3 Pharmaceuticals
8.3.1 Overview
8.3.2 Pharmaceuticals Market Revenue and Forecasts to 2027 (US$ Mn)
8.4 Cosmetics
8.4.1 Overview
8.4.2 Cosmetics Market Revenue and Forecasts to 2027 (US$ Mn)
8.5 Environmental
8.5.1 Overview
8.5.2 Environmental Market Revenue and Forecasts to 2027 (US$ Mn)
8.6 Food and Beverage
8.6.1 Overview
8.6.2 Food and Beverage Market Revenue and Forecasts to 2027 (US$ Mn)
9. Quantitative Structure-Activity Relationship Market Revenue and Forecasts to 2027 – Geographical Analysis
9.1 Europe: Quantitative Structure-Activity Relationship (QSAR) Market
9.1.1 Overview
9.1.2 Europe: Quantitative Structure-Activity Relationship (QSAR) Market, by Country, 2019 & 2027 (%)
9.1.2.1 Germany: Quantitative Structure-Activity Relationship (QSAR) Market – Revenue and Forecast to 2027 (USD Million)
9.1.2.1.1 Germany: Quantitative Structure-Activity Relationship (QSAR) Market – Revenue and Forecast to 2027 (USD Million)
9.1.2.1.2 Germany: Quantitative Structure-Activity Relationship (QSAR) Market, by Application– Revenue and Forecast to 2027 (USD Million)
9.1.2.1.3 Germany: Quantitative Structure-Activity Relationship (QSAR) Market, by Industry– Revenue and Forecast to 2027 (USD Million)
9.1.2.2 France: Quantitative Structure-Activity Relationship (QSAR) Market – Revenue and Forecast to 2027 (USD Million)
9.1.2.2.1 France: Quantitative Structure-Activity Relationship (QSAR) Market – Revenue and Forecast to 2027 (USD Million)
9.1.2.2.2 France: Quantitative Structure-Activity Relationship (QSAR) Market, by Application– Revenue and Forecast to 2027 (USD Million)
9.1.2.2.3 France: Quantitative Structure-Activity Relationship (QSAR) Market, by Industry– Revenue and Forecast to 2027 (USD Million)
9.1.2.3 UK: Quantitative Structure-Activity Relationship (QSAR) Market – Revenue and Forecast to 2027 (USD Million)
9.1.2.3.1 UK: Quantitative Structure-Activity Relationship (QSAR) Market – Revenue and Forecast to 2027 (USD Million)
9.1.2.3.2 UK: Quantitative Structure-Activity Relationship (QSAR) Market, by Application– Revenue and Forecast to 2027 (USD Million)
9.1.2.3.3 UK: Quantitative Structure-Activity Relationship (QSAR) Market, by Industry– Revenue and Forecast to 2027 (USD Million)
9.1.2.4 Italy: Quantitative Structure-Activity Relationship (QSAR) Market – Revenue and Forecast to 2027 (USD Million)
9.1.2.4.1 Italy: Quantitative Structure-Activity Relationship (QSAR) Market – Revenue and Forecast to 2027 (USD Million)
9.1.2.4.2 Italy: Quantitative Structure-Activity Relationship (QSAR) Market, by Application– Revenue and Forecast to 2027 (USD Million)
9.1.2.4.3 Italy: Quantitative Structure-Activity Relationship (QSAR) Market, by Industry– Revenue and Forecast to 2027 (USD Million)
9.1.2.5 Spain: Quantitative Structure-Activity Relationship (QSAR) Market – Revenue and Forecast to 2027 (USD Million)
9.1.2.5.1 Spain: Quantitative Structure-Activity Relationship (QSAR) Market – Revenue and Forecast to 2027 (USD Million)
9.1.2.5.2 Spain: Quantitative Structure-Activity Relationship (QSAR) Market, by Application– Revenue and Forecast to 2027 (USD Million)
9.1.2.5.3 Spain: Quantitative Structure-Activity Relationship (QSAR) Market, by Industry– Revenue and Forecast to 2027 (USD Million)
9.1.2.6 Rest of Europe: Quantitative Structure-Activity Relationship (QSAR) Market – Revenue and Forecast to 2027 (USD Million)
9.1.2.6.1 Rest of Europe: Quantitative Structure-Activity Relationship (QSAR) Market – Revenue and Forecast to 2027 (USD Million)
9.1.2.6.2 Rest of Europe: Quantitative Structure-Activity Relationship (QSAR) Market, by Application– Revenue and Forecast to 2027 (USD Million)
9.1.2.6.3 Rest of Europe: Quantitative Structure-Activity Relationship (QSAR) Market, by Industry– Revenue and Forecast to 2027 (USD Million)
10. Impact of COVID-19 Pandemic on Europe Quantitative Structure-Activity Relationship Market
10.1 Europe: Impact Assessment of COVID-19 Pandemic
11. Industry Landscape
11.1 Overview
11.2 Growth Strategies Done by the Companies in the Market, (%)
11.3 Organic Developments
11.3.1 Overview
11.4 Inorganic Developments
11.4.1 Overview
12. Company Profiles
12.1 ProtoQSAR SL
12.1.1 Key Facts
12.1.2 Business Description
12.1.3 Products and Services
12.1.4 Financial Overview
12.1.5 SWOT Analysis
12.1.6 Key Developments
12.2 Intertek Group Plc
12.2.1 Key Facts
12.2.2 Business Description
12.2.3 Products and Services
12.2.4 Financial Overview
12.2.5 SWOT Analysis
12.2.6 Key Developments
12.3 Dassault Systems SE
12.3.1 Key Facts
12.3.2 Business Description
12.3.3 Products and Services
12.3.4 Financial Overview
12.3.5 SWOT Analysis
12.3.6 Key Developments
12.4 Bibra Toxicology Advice & Consulting Ltd
12.4.1 Key Facts
12.4.2 Business Description
12.4.3 Products and Services
12.4.4 Financial Overview
12.4.5 SWOT Analysis
12.4.6 Key Developments
12.5 Laboratory Corporation of America Holdings
12.5.1 Key Facts
12.5.2 Business Description
12.5.3 Products and Services
12.5.4 Financial Overview
12.5.5 SWOT Analysis
12.5.6 Key Developments
12.6 QSAR LAB SP. Z O
12.6.1 Key Facts
12.6.2 Business Description
12.6.3 Products and Services
12.6.4 Financial Overview
12.6.5 SWOT Analysis
12.6.6 Key Developments
13. Appendix
13.1 About the Insight Partners
13.2 Glossary of Terms
LIST OF TABLES
Table 1. Germany: Quantitative Structure-Activity Relationship (QSAR) Market, by Application– Revenue and Forecast to 2027 (USD Million)
Table 2. Germany: Quantitative Structure-Activity Relationship (QSAR) Market, by Industry – Revenue and Forecast to 2027 (USD Million)
Table 3. France: Quantitative Structure-Activity Relationship (QSAR) Market, by Application– Revenue and Forecast to 2027 (USD Million)
Table 4. France: Quantitative Structure-Activity Relationship (QSAR) Market, by Industry – Revenue and Forecast to 2027 (USD Million)
Table 5. UK: Quantitative Structure-Activity Relationship (QSAR) Market, by Application– Revenue and Forecast to 2027 (USD Million)
Table 6. UK: Quantitative Structure-Activity Relationship (QSAR) Market, by Industry – Revenue and Forecast to 2027 (USD Million)
Table 7. Italy: Quantitative Structure-Activity Relationship (QSAR) Market, by Application– Revenue and Forecast to 2027 (USD Million)
Table 8. Italy: Quantitative Structure-Activity Relationship (QSAR) Market, by Industry – Revenue and Forecast to 2027 (USD Million)
Table 9. Spain: Quantitative Structure-Activity Relationship (QSAR) Market, by Application– Revenue and Forecast to 2027 (USD Million)
Table 10. Spain: Quantitative Structure-Activity Relationship (QSAR) Market, by Industry – Revenue and Forecast to 2027 (USD Million)
Table 11. Rest of Europe: Quantitative Structure-Activity Relationship (QSAR) Market, by Application– Revenue and Forecast to 2027 (USD Million)
Table 12. Rest of Europe: Quantitative Structure-Activity Relationship (QSAR) Market, by Industry – Revenue and Forecast to 2027 (USD Million)
Table 13. Organic Developments Done By Companies
Table 14. Inorganic Developments Done By Companies
Table 15. Glossary of Terms, Quantitative Structure-Activity Relationship Market
LIST OF FIGURES
Figure 1. Quantitative Structure-Activity Relationship Market Segmentation
Figure 2. Europe Quantitative Structure-Activity Relationship Market Overview
Figure 3. Drug Discovery Segment Held Largest Share of Application in Quantitative Structure-Activity Relationship Market
Figure 4. Germany is Expected to Show Remarkable Growth During the Forecast Period
Figure 5. Quantitative Structure-Activity Relationship Market - Europe PEST Analysis
Figure 6. Quantitative Structure-Activity Relationship Market Impact Analysis of Driver and Restraints
Figure 7. Europe Quantitative Structure-Activity Relationship Market – Revenue Forecasts and Analysis – 2019- 2027
Figure 8. Quantitative Structure-activity Relationship (QSAR) Market breakdown, by Application, 2019 and 2027 (%)
Figure 9. Drug Discovery Market Revenue And Forecasts to 2027 (US$ Mn)
Figure 10. Molecular Modelling Market Revenue and Forecasts to 2027 (US$ Mn)
Figure 11. Chemical Screening Market Revenue and Forecasts to 2027 (US$ Mn)
Figure 12. Regulatory and Decision-Making Market Revenue and Forecasts to 2027 (US$ Mn)
Figure 13. Others Market Revenue and Forecasts to 2027 (US$ Mn)
Figure 14. Quantitative Structure-Activity Relationship (QSAR) Market breakdown, by, 2019 and 2027 (%)
Figure 15. Pharmaceuticals Market Revenue And Forecasts to 2027 (US$ Mn)
Figure 16. Cosmetics Market Revenue and Forecasts to 2027 (US$ Mn)
Figure 17. Environmental Market Revenue and Forecasts to 2027 (US$ Mn)
Figure 18. Food and Beverage Market Revenue and Forecasts to 2027 (US$ Mn)
Figure 19. Europe: Quantitative Structure-Activity Relationship (QSAR) Market, by Key Country – Revenue (2019) (USD Million)
Figure 20. Europe: Quantitative Structure-Activity Relationship (QSAR) Market, by Country, 2019 & 2027 (%)
Figure 21. Germany: Quantitative Structure-Activity Relationship (QSAR) Market – Revenue and Forecast to 2027 (USD Million)
Figure 22. France: Quantitative Structure-Activity Relationship (QSAR) Market – Revenue and Forecast to 2027 (USD Million)
Figure 23. UK: Quantitative Structure-Activity Relationship (QSAR) Market – Revenue and Forecast to 2027 (USD Million)
Figure 24. Italy: Quantitative Structure-Activity Relationship (QSAR) Market – Revenue and Forecast to 2027 (USD Million)
Figure 25. Spain: Quantitative Structure-Activity Relationship (QSAR) Market – Revenue and Forecast to 2027 (USD Million)
Figure 26. Rest of Europe: Quantitative Structure-Activity Relationship (QSAR) Market – Revenue and Forecast to 2027 (USD Million)
Figure 27. Impact of COVID-19 Pandemic in European Country Markets
Figure 28. Growth Strategies Done by the Companies in the Market, (%)
- ProtoQSAR SL
- Intertek Group Plc
- Dassault Systems SE
- Bibra Toxicology Advice & Consulting Ltd
- Laboratory Corporation of America Holdings
- QSAR LAB SP. Z O
- Save and reduce time carrying out entry-level research by identifying the growth, size, leading players and segments in the Europe quantitative structure-activity relationship market.
- Highlights key business priorities in order to assist companies to realign their business strategies
- The key findings and recommendations highlight crucial progressive industry trends in the Europe quantitative structure-activity relationship market, thereby allowing players across the value chain to develop effective long-term strategies
- Develop/modify business expansion plans by using substantial growth offering developed and emerging markets
- Scrutinize in-depth Europe market trends and outlook coupled with the factors driving the quantitative structure-activity relationship market, as well as those hindering it
- Enhance the decision-making process by understanding the strategies that underpin commercial interest with respect to client products, segmentation, pricing and distribution