Europe 3D Display Market Forecast to 2028 - COVID-19 Impact and Regional Analysis By Type (Stereoscopic 3D Display and Autostereoscopic 3D Display), Technology (Digital Light Processing, Organic Light Emitting Diode, and Light Emitting Diode), and Application (Consumer Electronics, Automotive, Medical, Advertising, Retail, Military and Defense, and Others)
Market Introduction
Europe comprises developed economies, such as Germany, Russia, France, the UK, and Italy. Apart from automotive, media & entertainment is one of the biggest industries in Europe. The popularity of 3D movies has witnessed a steep rise from the last few years. Several movies theatres based in the region are adopting 3D displays to enhance the viewer experience. For instance, in March 2018, Arena Cinemas, a Switzerland-based theatre, installed Samsung’s 3D cinema LED. The screen maintains reliable brightness for perfect delivery of subtitle text, images, and minor visual details for viewers. Samsung’s Digital Cinema Initiatives certified high dynamic range theater Cinema LED screen display offers consumers a next-generation viewing experience. Switzerland is one of the growing hubs in the region for the film industry and a perfect location to introduce 3D Cinema LED screen. The 3D display design enabled Arena Cinemas to eradicate its projector closet, which makes room for additional seats. Thus, growing advancements in the media & entertainment industry would significantly push the European market toward growth during the forecast period.
Russia, the UK, France, Spain, Italy, and Germany are among the worst-affected European countries by the COVID-19 pandemic. Businesses in the region are facing severe economic difficulties as they had to suspend operations or reduce activities in a substantial manner. The region is a major manufacturing and industrial hub for sectors such as consumer electronics and automotive. Hence, due to business lockdowns, travel bans, and supply chain disruptions, Europe witnessed an economic slowdown till Mid-2021. Italy, Spain, and Germany implemented drastic measures and travel restrictions to limit the spread of COVID-19 in 2020 and in several months in 2021. European countries are the major developers and adopters of 3D displays due to the high purchasing power of people and the presence of evolved advertising industry. The region invests huge resources in the development of 3D display technologies for the automotive industry. Major automotive players such as Continental AG and Volkswagen have implemented holographic displays in their vehicles. However, upon the onset of COVID-19, the manufacturing of 3D display devices witnessed a sharp decline in European countries, and automotive and other industries were under stress till mid-2021. Moreover, disruptions in raw materials and electronic component supply from China further aggravated the difficulties of manufacturing industries in this region. All these factors limited the 3D display market growth in Europe in 2020 and early 2021.
Get more information on this report : 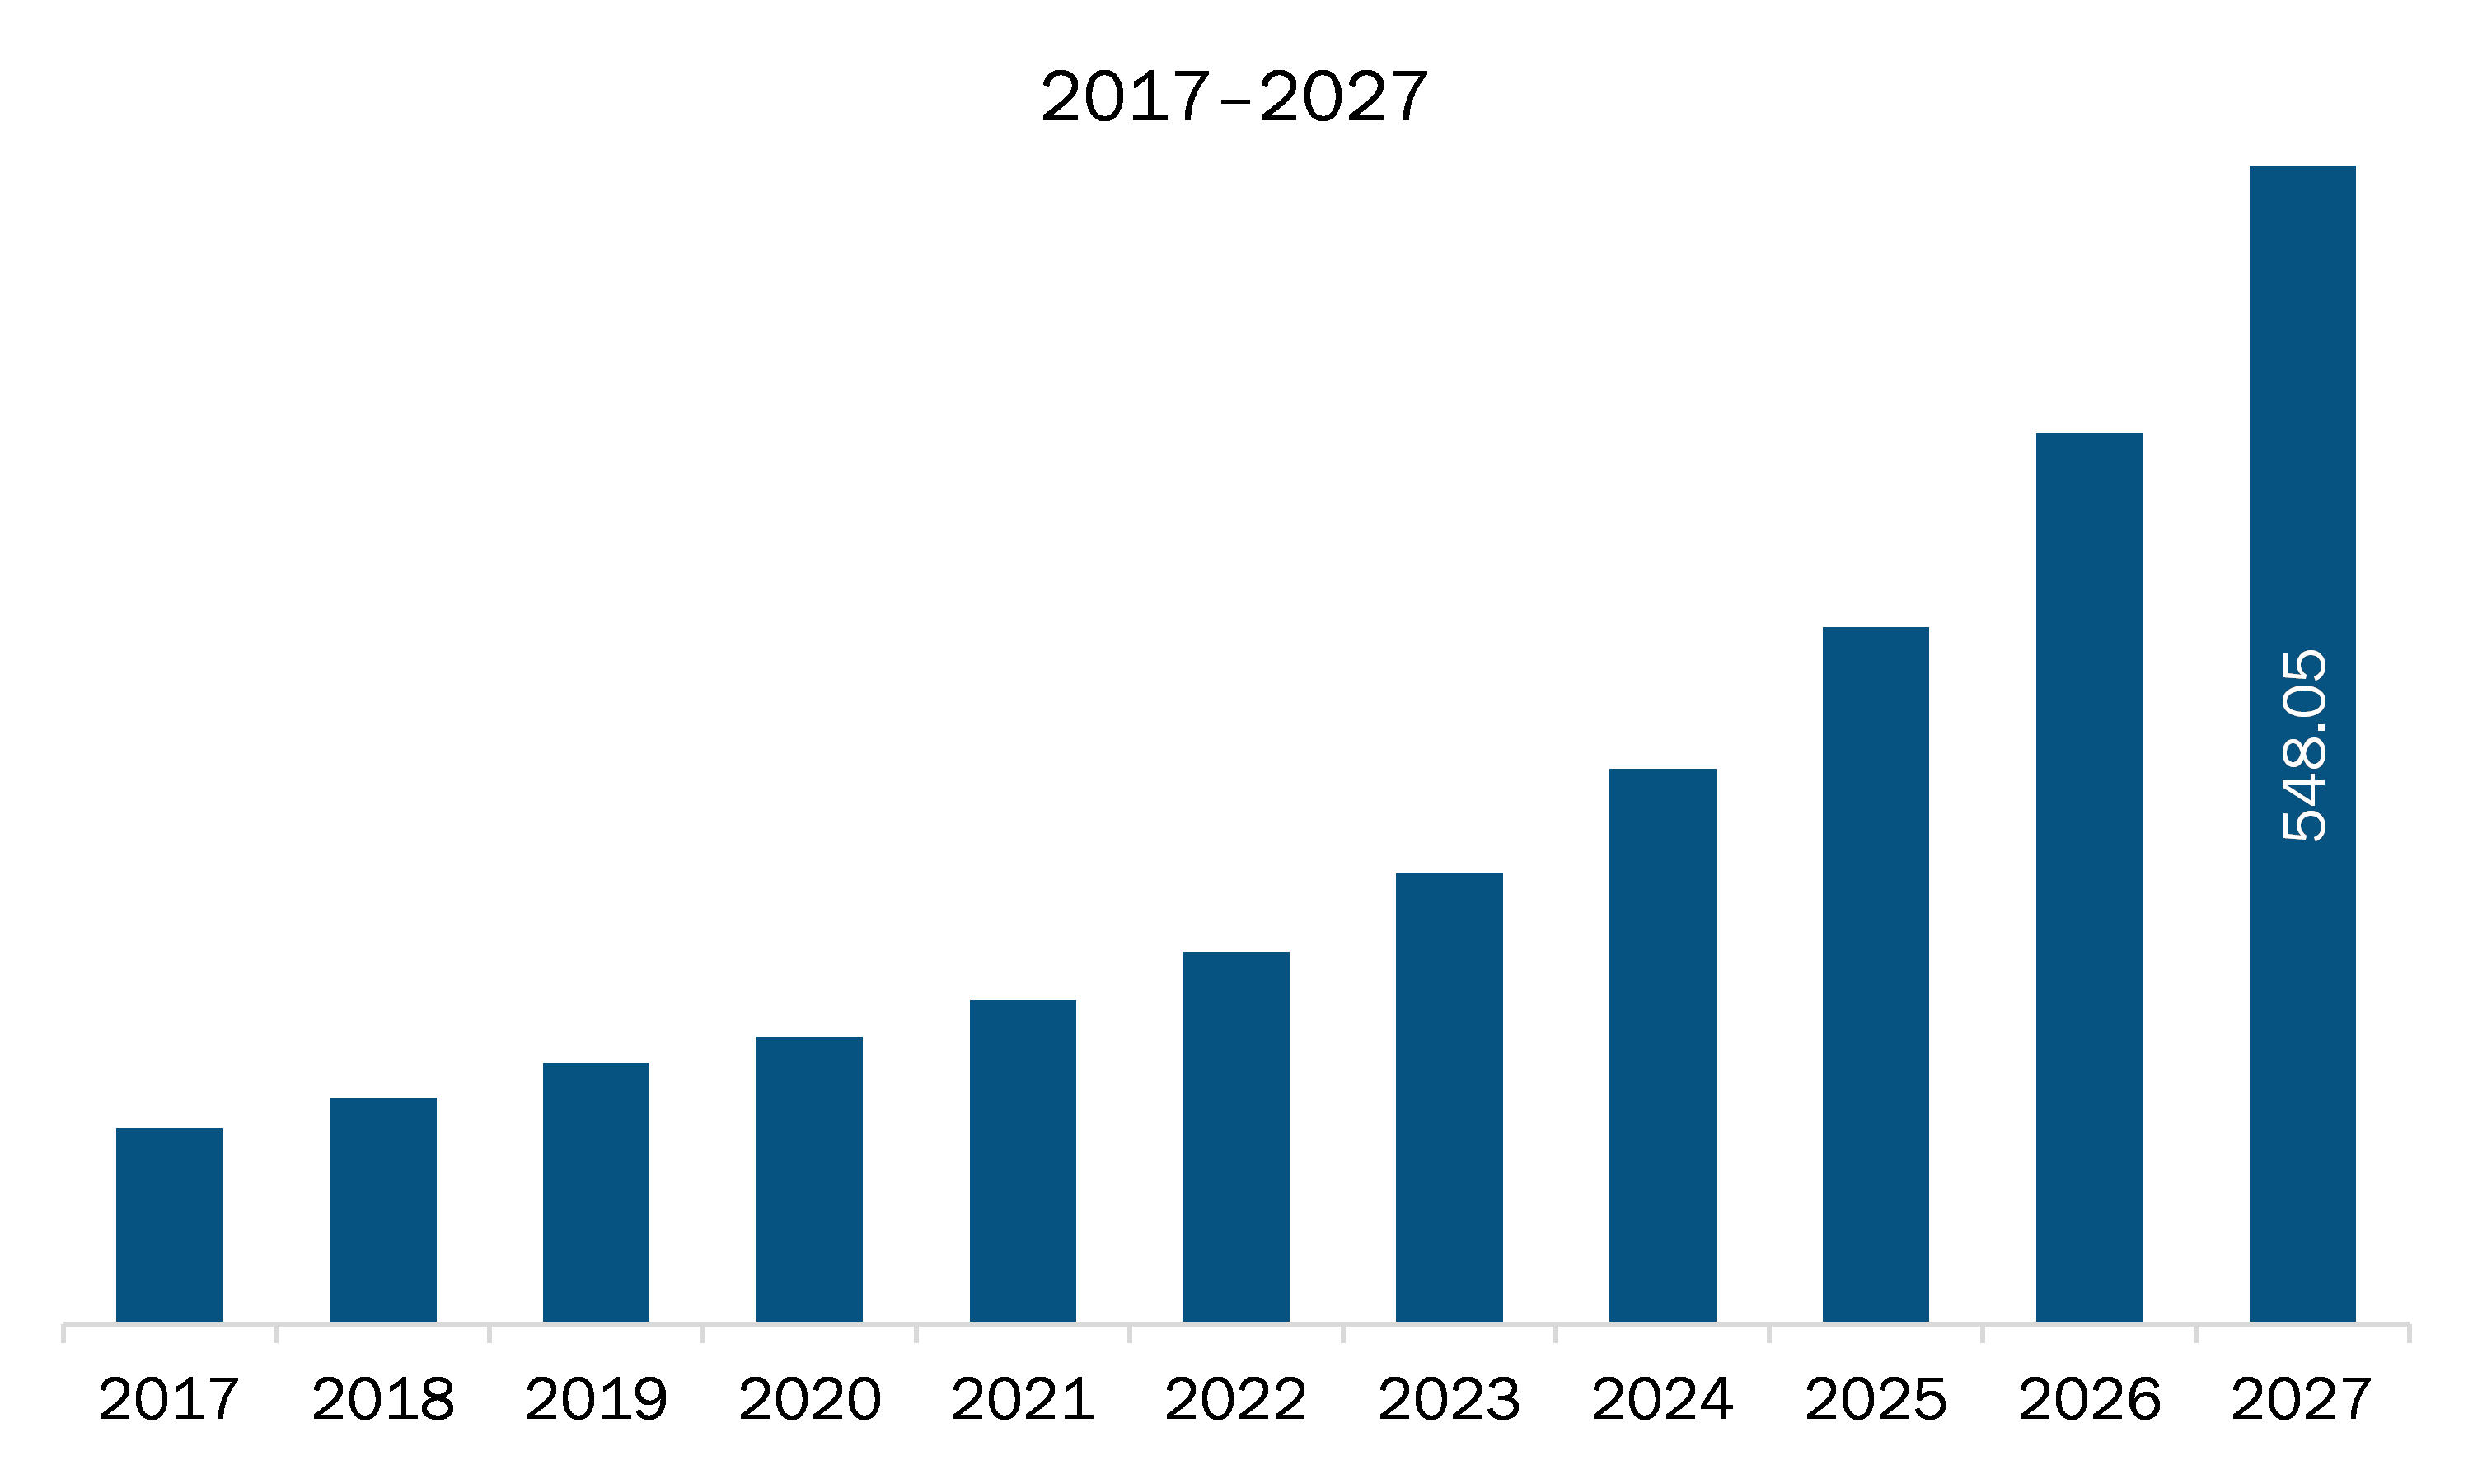
Market Overview and Dynamics
The 3D display market in Europe is expected to grow from US$ 143.30 million in 2021 to US$ 783.39 million by 2028; it is estimated to grow at a CAGR of 27.5% from 2021 to 2028. Holographic display technology generates arbitrary wave fronts which can be considered as an ultimate 3D experience for end-user. In comparison of 2D image-based stereoscopic displays that are used to create 3D perception which can create issues such as headache, visual discomfort, eyestrain, and fatigue in some users, the holographic 3D displays are quite comfortable for users who want to experience realistic 3D. Another type of glassless 3D display technology includes volumetric displays, these displays use components distributed in a volume which scatter light in multiple directions, thus creating a realistic 3D experience. However, the requirement of high volume for these displays makes them difficult to use in many potential applications. Thus, holographic 3D displays which use a 2D surface by exploiting wave nature of light to develop 3D images are considered a more viable option for potential 3D display applications in fields such as marketing, advertising, medical, automotive, education, entertainment, retail, hospitality, events, sports, and digital signage among many others.
Key Market Segments
The Europe 3D display market is segmented into type, technology, application, and country. Based on type, the Europe 3D display market is segmented into stereoscopic 3D display and autostereoscopic 3D display. Autostereoscopic 3D display segment held the largest market share in 2020. Based on technology, the 3D display market is divided into digital light processing, organic light emitting diode, and light emitting diode. Digital light processing segment held the largest market share in 2020. Based on application, the Europe 3D display market is divided into consumer electronics, automobile, medical, advertising, retail, military and defense, and others. Advertising segment held the largest market share in 2020. Based on country the Europe 3D display market is segmented into France, Germany, Italy, UK, Russia, and rest of Europe. Rest of Europe held the largest market share in 2020.
Major Sources and Companies Listed
A few major primary and secondary sources referred to for preparing this report on the 3D display market in Europe are company websites, annual reports, financial reports, national government documents, and statistical database, among others. Major companies listed in the report are AU Optronics Corp., BOE Technology Group, Fujifilm Corporation, Innolux Corporation, Leia Inc., LG Electronics Inc., Looking Glass Factory Inc., Mitsubishi Electric Corporation, Panasonic Corporation, Samsung Group, Sharp Corporation, Sony Corporation, and Toshiba Corporation.
Reasons to buy report
- To understand the Europe 3D display market landscape and identify market segments that are most likely to guarantee a strong return
- Stay ahead of the race by comprehending the ever-changing competitive landscape for Europe 3D display market
- Efficiently plan M&A and partnership deals in Europe 3D display market by identifying market segments with the most promising probable sales
- Helps to take knowledgeable business decisions from perceptive and comprehensive analysis of market performance of various segment form Europe 3D display market
- Obtain market revenue forecast for market by various segments from 2021-2028 in Europe region.
Europe 3D Display Market Segmentation
Europe 3D Display Market - By Type
- Stereoscopic 3D Display
- Autostereoscopic 3D Display
Europe 3D Display Market - By Technology
- Digital Light Processing
- Organic Light Emitting Diode
- Light Emitting Diode
Europe 3D Display Market - By Application
- Consumer Electronics
- Automotive
- Medical
- Advertising
- Retail
- Military and Defense
- Others
Europe 3D Display Market, By Country
- Germany
- France
- Italy
- UK
- Russia
- Rest of Europe
Europe 3D Display Market - Company Profiles
- AU Optronics Corp.
- BOE Technology Group
- Fujifilm Corporation
- Innolux Corporation
- Leia Inc.
- LG Electronics Inc.
- Looking Glass Factory Inc
- Mitsubishi Electric Corporation
- Panasonic Corporation
- Samsung Group
- Sharp Corporation
- Sony Corporation
- Toshiba Corporation
1. Introduction
1.1 Study Scope
1.2 The Insight Partners Research Report Guidance
1.3 Market Segmentation
2. Key Takeaways
3. Research Methodology
3.1 Coverage
3.2 Secondary Research
3.3 Primary Research
4. Europe 3D Display Market Landscape
4.1 Market Overview
4.2 Europe PEST Analysis
4.3 Ecosystem Analysis
4.4 Expert Opinion
5. 3D Display Market – Europe Analysis
5.1 Europe 3D Display Market Overview
5.2 Europe 3D Display Market – Revenue and Forecast to 2028 (US$ Million)
6. Europe 3D Display Market – Key Market Dynamics
6.1 Market Drivers
6.1.1 Advanced 3D Display Technologies Finding Huge Usage in End-User Industries
6.2 Market Restraints
6.2.1 Cost Problems Related to 3D Display Technologies
6.3 Market Opportunities
6.3.1 Rising Industry Collaborations to Increase the Demand
6.4 Future Trends
6.4.1 Rise in Growth Owing to Holographic 3D Display Systems
6.5 Impact Analysis of Drivers and Restraints
7. Europe 3D Display Market Analysis– By Type
7.1 Overview
7.2 Europe 3D Display Market, by Type (2020 and 2028)
7.3 Stereoscopic 3D Display
7.3.1 Overview
7.3.2 Stereoscopic 3D Display: 3D Display Market – Revenue and Forecast to 2028 (US$ Million)
7.4 Autostereoscopic 3D Display
7.4.1 Overview
7.4.2 Autostereoscopic 3D Display: 3D Display Market – Revenue and Forecast to 2028 (US$ Million)
8. Europe 3D Display Market Analysis – By Technology
8.1 Overview
8.2 Europe 3D Display Market, by Technology (2020 and 2028)
8.3 Digital Light Processing
8.3.1 Overview
8.3.2 Digital Light Processing: 3D Display Market – Revenue and Forecast to 2028 (US$ Million)
8.4 Organic Light Emitting Diode
8.4.1 Overview
8.4.2 Organic Light Emitting Diode: 3D Display Market – Revenue and Forecast to 2028 (US$ Million)
8.5 Light Emitting Diode
8.5.1 Overview
8.5.2 Light Emitting Diode: 3D Display Market – Revenue and Forecast to 2028 (US$ Million)
9. Europe 3D Display Market Analysis – By Application
9.1 Overview
9.2 Europe 3D Display Market, by Application (2020 and 2028)
9.3 Consumer electronics
9.3.1 Overview
9.3.2 Consumer Electronics: 3D Display Market – Revenue and Forecast to 2028 (US$ Million)
9.4 Automotive
9.4.1 Overview
9.4.2 Automotive: 3D Display Market – Revenue and Forecast to 2028 (US$ Million)
9.5 Medical
9.5.1 Overview
9.5.2 Medical: 3D Display Market – Revenue and Forecast to 2028 (US$ Million)
9.6 Advertising
9.6.1 Overview
9.6.2 Advertising: 3D Display Market – Revenue and Forecast to 2028 (US$ Million)
9.7 Retail
9.7.1 Overview
9.7.2 Retail: 3D Display Market – Revenue and Forecast to 2028 (US$ Million)
9.8 Military & Defense
9.8.1 Overview
9.8.2 Military & Defense: 3D Display Market – Revenue and Forecast to 2028 (US$ Million)
9.9 Other Applications
9.9.1 Overview
9.9.2 Other Applications: 3D Display Market – Revenue and Forecast to 2028 (US$ Million)
10. Europe 3D Display Market – Country Analysis
10.1 Overview
10.1.1 Europe: 3D Display Market, By Country
10.1.1.1 Germany: 3D Display Market – Revenue and Forecast to 2028 (US$ Million)
10.1.1.1.1 Germany: 3D Display Market, by Type
10.1.1.1.2 Germany: 3D Display Market, by Technology
10.1.1.1.3 Germany: 3D Display Market, by Application
10.1.1.2 France: 3D Display Market – Revenue and Forecast to 2028 (US$ Million)
10.1.1.2.1 France: 3D Display Market, by Type
10.1.1.2.2 France: 3D Display Market, by Technology
10.1.1.2.3 France: 3D Display Market, by Application
10.1.1.3 Italy: 3D Display Market – Revenue and Forecast to 2028 (US$ Million)
10.1.1.3.1 Italy: 3D Display Market, by Type
10.1.1.3.2 Italy: 3D Display Market, by Technology
10.1.1.3.3 Italy: 3D Display Market, by Application
10.1.1.4 UK: 3D Display Market – Revenue and Forecast to 2028 (US$ Million)
10.1.1.4.1 UK: 3D Display Market, by Type
10.1.1.4.2 UK: 3D Display Market, by Technology
10.1.1.4.3 UK: 3D Display Market, by Application
10.1.1.5 Russia: 3D Display Market – Revenue and Forecast to 2028 (US$ Million)
10.1.1.5.1 Russia: 3D Display Market, by Type
10.1.1.5.2 Russia: 3D Display Market, by Technology
10.1.1.5.3 Russia: 3D Display Market, by Application
10.1.1.6 Rest of Europe: 3D Display Market – Revenue and Forecast to 2028 (US$ Million)
10.1.1.6.1 Rest of Europe: 3D Display Market, by Type
10.1.1.6.2 Rest of Europe: 3D Display Market, by Technology
10.1.1.6.3 Rest of Europe: 3D Display Market, by Application
11. Europe 3D Display Market- Impact Analysis of COVID-19
11.1 Europe
12. Industry Landscape
12.1 Market Developments
13. Company Profiles
13.1 AU OPTRONICS CORP.
13.1.1 Key Facts
13.1.2 Business Description
13.1.3 Products and Services
13.1.4 Financial Overview
13.1.5 SWOT Analysis
13.1.6 Key Developments
13.2 Innolux Corporation
13.2.1 Key Facts
13.2.2 Business Description
13.2.3 Products and Services
13.2.4 Financial Overview
13.2.5 SWOT Analysis
13.2.6 Key Developments
13.3 LG Electronics
13.3.1 Key Facts
13.3.2 Business Description
13.3.3 Products and Services
13.3.4 Financial Overview
13.3.5 SWOT Analysis
13.3.6 Key Developments
13.4 Mitsubishi Electric Corporation
13.4.1 Key Facts
13.4.2 Business Description
13.4.3 Products and Services
13.4.4 Financial Overview
13.4.5 SWOT Analysis
13.4.6 Key Developments
13.5 Panasonic Corporation
13.5.1 Key Facts
13.5.2 Business Description
13.5.3 Products and Services
13.5.4 Financial Overview
13.5.5 SWOT Analysis
13.5.6 Key Developments
13.6 Samsung Group
13.6.1 Key Facts
13.6.2 Business Description
13.6.3 Products and Services
13.6.4 Financial Overview
13.6.5 SWOT Analysis
13.6.6 Key Developments
13.7 Sharp Corporation
13.7.1 Key Facts
13.7.2 Business Description
13.7.3 Products and Services
13.7.4 Financial Overview
13.7.5 SWOT Analysis
13.7.6 Key Developments
13.8 Looking Glass Factory Inc.
13.8.1 Key Facts
13.8.2 Business Description
13.8.3 Products and Services
13.8.4 Financial Overview
13.8.5 SWOT Analysis
13.8.6 Key Developments
13.9 Leia Inc.
13.9.1 Key Facts
13.9.2 Business Description
13.9.3 Products and Services
13.9.4 Financial Overview
13.9.5 SWOT Analysis
13.9.6 Key Developments
13.10 Sony Corporation
13.10.1 Key Facts
13.10.2 Business Description
13.10.3 Products and Services
13.10.4 Financial Overview
13.10.5 SWOT Analysis
13.10.6 Key Developments
13.11 Toshiba Corporation
13.11.1 Key Facts
13.11.2 Business Description
13.11.3 Products and Services
13.11.4 Financial Overview
13.11.5 SWOT Analysis
13.11.6 Key Developments
13.12 Fujifilm Corporation
13.12.1 Key Facts
13.12.2 Business Description
13.12.3 Products and Services
13.12.4 Financial Overview
13.12.5 SWOT Analysis
13.12.6 Key Developments
13.13 BOE Technology Group
13.13.1 Key Facts
13.13.2 Business Description
13.13.3 Products and Services
13.13.4 Financial Overview
13.13.5 SWOT Analysis
13.13.6 Key Developments
14. Appendix
14.1 About The Insight Partners
14.2 Word Index
LIST OF TABLES
Table 1. Europe 3D Display Market – Revenue and Forecast to 2028 (US$ Million)
Table 2. Germany 3D Display Market, By Type – Revenue and Forecast to 2028 (US$ Million)
Table 3. Germany 3D Display Market, by Technology – Revenue and Forecast to 2028 (US$ Million)
Table 4. Germany 3D Display Market, By Application – Revenue and Forecast to 2028 (US$ Million)
Table 5. France 3D Display Market, By Type – Revenue and Forecast to 2028 (US$ Million)
Table 6. France 3D Display Market, by Technology – Revenue and Forecast to 2028 (US$ Million)
Table 7. France 3D Display Market, By Application – Revenue and Forecast to 2028 (US$ Million)
Table 8. Italy 3D Display Market, By Type – Revenue and Forecast to 2028 (US$ Million)
Table 9. Italy 3D Display Market, by Technology – Revenue and Forecast to 2028 (US$ Million)
Table 10. Italy 3D Display Market, By Application – Revenue and Forecast to 2028 (US$ Million)
Table 11. UK 3D Display Market, By Type – Revenue and Forecast to 2028 (US$ Million)
Table 12. UK 3D Display Market, by Technology – Revenue and Forecast to 2028 (US$ Million)
Table 13. UK 3D Display Market, By Application – Revenue and Forecast to 2028 (US$ Million)
Table 14. Russia 3D Display Market, By Type – Revenue and Forecast to 2028 (US$ Million)
Table 15. Russia 3D Display Market, by Technology – Revenue and Forecast to 2028 (US$ Million)
Table 16. Russia 3D Display Market, By Application – Revenue and Forecast to 2028 (US$ Million)
Table 17. Rest of Europe 3D Display Market, By Type – Revenue and Forecast to 2028 (US$ Million)
Table 18. Rest of Europe 3D Display Market, by Technology – Revenue and Forecast to 2028 (US$ Million)
Table 19. Rest of Europe 3D Display Market, By Application – Revenue and Forecast to 2028 (US$ Million)
Table 20. List of Abbreviation
LIST OF FIGURES
Figure 1. Europe 3D Display Market Segmentation
Figure 2. Europe 3D Display Market Segmentation – By Country
Figure 3. Europe 3D Display Market Overview
Figure 4. Autostereoscopic 3D display segment Held the Largest Share During Forecast Period
Figure 5. Digital Light Processing Segment Held the Largest Share During Forecast Period
Figure 6. Advertising segment Held the Largest Share During Forecast Period
Figure 7. Europe 3D Display Market, Country Analysis
Figure 8. Europe: PEST Analysis
Figure 9. Europe 3D Display Market– Ecosystem Analysis
Figure 10. Expert Opinion
Figure 11. Europe 3D Display Market – Revenue and Forecast to 2028 (US$ Million)
Figure 12. Europe 3D Display Market: Impact Analysis of Drivers and Restraints
Figure 13. Europe 3D Display Market Revenue Share, by Type (2020 and 2028)
Figure 14. Europe Stereoscopic 3D Display: 3D Display Market – Revenue and Forecast to 2028 (US$ Million)
Figure 15. Europe Autostereoscopic 3D Display: 3D Display Market – Revenue and Forecast to 2028 (US$ Million)
Figure 16. Europe 3D Display Market Revenue Share, by Technology (2020 and 2028)
Figure 17. Europe Digital Light Processing: 3D Display Market – Revenue and Forecast to 2028 (US$ Million)
Figure 18. Europe Organic Light Emitting Diode: 3D Display Market– Revenue and Forecast to 2028 (US$ Million)
Figure 19. Europe Light Emitting Diode: 3D Display Market – Revenue and Forecast to 2028 (US$ Million)
Figure 20. Europe 3D Display Market Revenue Share, by Application (2020 and 2028)
Figure 21. Europe Consumer Electronics: 3D Display Market – Revenue and Forecast to 2028 (US$ Million)
Figure 22. Europe Automotive: 3D Display Market – Revenue and Forecast to 2028 (US$ Million)
Figure 23. Europe Medical: 3D Display Market – Revenue and Forecast to 2028 (US$ Million)
Figure 24. Europe Advertising: 3D Display Market – Revenue and Forecast to 2028 (US$ Million)
Figure 25. Europe Retail: 3D Display Market – Revenue and Forecast to 2028 (US$ Million)
Figure 26. Europe Military & Defense: 3D Display Market – Revenue and Forecast to 2028 (US$ Million)
Figure 27. Europe Others: 3D Display Market – Revenue and Forecast to 2028 (US$ Million)
Figure 28. Europe: 3D Display Market, by Key Country – Revenue (2020) (US$ Million)
Figure 29. Europe: 3D Display Market Revenue Share, By Country (2020 and 2028)
Figure 30. Germany: 3D Display Market – Revenue and Forecast to 2028 (US$ Million)
Figure 31. France: 3D Display Market – Revenue and Forecast to 2028 (US$ Million)
Figure 32. Italy: 3D Display Market – Revenue and Forecast to 2028 (US$ Million)
Figure 33. UK: 3D Display Market – Revenue and Forecast to 2028 (US$ Million)
Figure 34. Russia: 3D Display Market – Revenue and Forecast to 2028 (US$ Million)
Figure 35. Rest of Europe: 3D Display Market – Revenue and Forecast to 2028 (US$ Million)
Figure 36. Impact of COVID-19 Pandemic in Europe Country Markets
- AU Optronics Corp.
- BOE Technology Group
- Fujifilm Corporation
- Innolux Corporation
- Leia Inc.
- LG Electronics Inc.
- Looking Glass Factory Inc
- Mitsubishi Electric Corporation
- Panasonic Corporation
- Samsung Group
- Sharp Corporation
- Sony Corporation
- Toshiba Corporation
- Save and reduce time carrying out entry-level research by identifying the growth, size, leading players and segments in the Europe 3D display market
- Highlights key business priorities in order to assist companies to realign their business strategies
- The key findings and recommendations highlight crucial progressive industry trends in the Europe 3D display market, thereby allowing players across the value chain to develop effective long-term strategies
- Develop/modify business expansion plans by using substantial growth offering developed and emerging markets
- Scrutinize in-depth Europe market trends and outlook coupled with the factors driving the 3D display market, as well as those hindering it
- Enhance the decision-making process by understanding the strategies that underpin commercial interest with respect to client products, segmentation, pricing and distribution