Asia Pacific Graphene Market Forecast to 2028 – COVID-19 Impact and Analysis – by Type (Monolayer and Bilayer, Graphene Nano-platelets, Graphene Oxide, and Others) and Application (Composites, Functional Inks, Paints & Coatings, Energy Storage, Electronics, Polymer Additives, RFID, and Others)
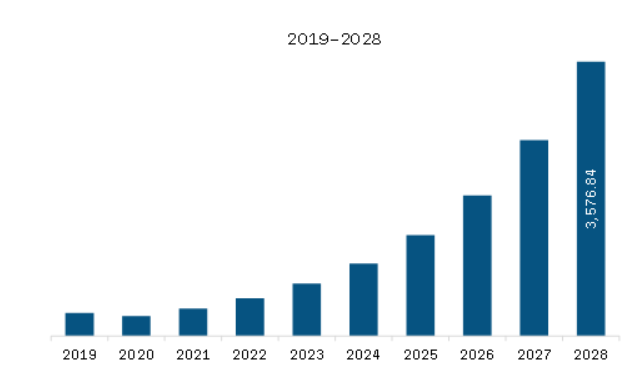
The graphene market in Asia Pacific is expected to grow from US$ 356.90 million in 2021 to US$ 3,576.84 million by 2028. It is estimated to grow at a CAGR of 39.0% from 2021 to 2028.
Composites are materials formed by combining two or more materials with varying properties to produce an end material with unique characteristics. Graphene composites are similarly produced, including graphene. The presence of graphene can create composites with excellent qualities and enhance the conductivity and strength of bulk materials. They enhance mechanical properties and dimensional stability and resist high temperatures, impacts, and flames. Graphene composites are widely used in medical implants, engineering materials for aerospace, building & construction, and renewables. Graphene and its derivatives can be functionalized and modified with several bioactive molecules. They can be combined with various biomaterials utilized in regenerative and reconstructive dentistry & medicine. The resultant graphene-modified composites exhibit enhanced mechanical properties and improved bioactivity.
Further, graphene composites decrease water permeability by ~400% compared to standard concrete. This makes this novel composite material ideal for construction in areas subject to flooding. Furthermore, graphene composites have multiple applications in other end-use industries, including electronics, automotive, and energy storage & generation. The growing demand from these industries is attributable to massive amounts of capital investments in building infrastructure for carrying out research activities in graphene composites. Besides, the rising demand for customized vehicles where composites are used to deliver desirable specifications and performance is also driving the graphene market. Thus, the growing demand for graphene composites in numerous end-use industries is a key factor in boosting the region's graphene market over the forecast period.
With new features and technologies, vendors can attract new customers and expand their footprints in emerging markets. This factor is likely to drive the Asia Pacific graphene market at a substantial CAGR during the forecast period.
Asia Pacific Graphene Market Revenue and Forecast to 2028 (US$ Million)
Asia Pacific Graphene Market Segmentation
The Asia Pacific graphene market is analyzed on the basis of type, application, and country. Based on type, the market is segmented into monolayer and bilayer, graphene nano-platelets, graphene oxide, and others. In 2020, the graphene oxide segment held the largest share of the market. The graphene nano-platelets segment is expected to register a higher CAGR during the forecast period. Based on application, the market is segmented into composites, functional inks, paints & coatings, energy storage, electronics, polymer additives, RFID, and others. In 2020, the electronics segment held the largest market share. The energy storage segment is expected to register the highest CAGR in the market during the forecast period.
Based on country, the Asia Pacific graphene market is segmented into Australia, China, India, Japan, South Korea, and the Rest of APAC. In 2020, China held the largest market share and is further expected to rise at the fastest CAGR during the forecast period.
XG Sciences; The Sixth Element Materials Technology Co., Ltd; Global Graphene Group; Graphenea, Inc.; Directa Plus S.p.A; AVANZARE INNOVACION TECNOLOGICA SL; Thomas Swan & Co. Ltd.; Morsh; and Perpetuus Advanced Materials PLC are the leading companies in the Asia Pacific graphene market.
1. Introduction
1.1 The Insight Partners Research Report Guidance
1.2 Market Segmentation
1.2.1 Asia Pacific Graphene Market, by Type
1.2.2 Asia Pacific Graphene Market, by Application
1.2.3 Asia Pacific Graphene Market, by Country
2. Key Takeaways
3. Research Methodology
3.1 Scope of the Study
3.2 Research Methodology
3.2.1 Data Collection:
3.2.2 Primary Interviews:
3.2.3 Hypothesis formulation:
3.2.4 Macro-economic factor analysis:
3.2.5 Developing base number:
3.2.6 Data Triangulation:
3.2.7 Country level data:
4. Asia Pacific Graphene Market Landscape
4.1 Market Overview
4.2 Porter’s Five Forces Analysis
4.2.1 Bargaining Power of Suppliers
4.2.2 Bargaining Power of Buyers
4.2.3 Threat of New Entrants
4.2.4 Competitive Rivalry
4.2.5 Threat of Substitutes
4.3 Ecosystem Analysis
4.3.1 List of Raw Material Suppliers
4.3.2 List of Manufacturers
4.3.3 List of Distributors
4.3.4 List of End Users
4.4 Expert Opinion
4.5 Patent Analysis
5. Asia Pacific Graphene Market — Key Market Dynamics
5.1 Market Drivers
5.1.1 Multiple Application Scope of Graphene
5.1.2 Burgeoning Demand for Graphene Composites in End-Use Industries
5.2 Market Restraints
5.2.1 Hazardous Impact of Graphene on Humans and Environment
5.3 Market Opportunities
5.3.1 Raising Demand for Consumer Electronics
5.4 Future Trends
5.4.1 Ramping Focus on Research and Development
5.5 Impact Analysis of Drivers and Restraints
6. Asia Pacific Graphene Market Analysis
6.1 Graphene Market Overview
6.2 Asia Pacific Graphene Market –Revenue and Forecast to 2028
7. Asia Pacific Graphene Market Analysis – By Type
7.1 Overview
7.2 Asia Pacific Graphene Market, by Type
7.3 Monolayer and Bilayer
7.3.1 Monolayer and Bilayer: Graphene Market – Revenue and Forecast to 2028 (US$ Million)
7.4 Graphene Nano-platelets
7.4.1 Graphene Nano-platelets : Graphene Market – Revenue and Forecast to 2028 (US$ Million)
7.5 Graphene Oxide
7.5.1 Graphene Oxide : Graphene Market – Revenue and Forecast to 2028 (US$ Million)
7.6 Others
7.6.1 Others : Graphene Market – Revenue and Forecast to 2028 (US$ Million)
8. Asia Pacific Graphene Market Analysis – by Application
8.1 Overview
8.2 Asia Pacific Graphene Market, by Application
8.3 Composites
8.3.1 Composites : Graphene Market – Revenue and Forecast to 2028 (US$ Million)
8.4 Functional Inks, Paints and Coatings
8.4.1 Functional Inks, Paints and Coatings: Graphene Market – Revenue and Forecast to 2028 (US$ Million)
8.5 Energy Storage
8.5.1 Energy Storage: Graphene Market – Revenue and Forecast to 2028 (US$ Million)
8.6 Electronics
8.6.1 Electronics: Graphene Market – Revenue and Forecast to 2028 (US$ Million)
8.7 Polymer Additives
8.7.1 Polymer Additives: Graphene Market – Revenue and Forecast to 2028 (US$ Million)
8.8 RFID
8.8.1 RFID: Graphene Market – Revenue and Forecast to 2028 (US$ Million)
8.9 Others
8.9.1 Others: Graphene Market – Revenue and Forecast to 2028 (US$ Million)
9. Asia Pacific Graphene Market – Country Analysis
9.1 Overview
9.1.1 Asia Pacific: Graphene Market, by Key Country
9.1.1.1 Australia: Graphene Market –Revenue and Forecast to 2028 (US$ Million)
9.1.1.1.1 Australia: Graphene Market, by Type
9.1.1.1.2 Australia: Graphene Market, by Application
9.1.1.2 China: Graphene Market –Revenue and Forecast to 2028 (US$ Million)
9.1.1.2.1 China: Graphene Market, by Type
9.1.1.2.2 China: Graphene Market, by Application
9.1.1.3 India: Graphene Market –Revenue and Forecast to 2028 (US$ Million)
9.1.1.3.1 India: Graphene Market, by Type
9.1.1.3.2 India: Graphene Market, by Application
9.1.1.4 Japan: Graphene Market –Revenue and Forecast to 2028 (US$ Million)
9.1.1.4.1 Japan: Graphene Market, by Type
9.1.1.4.2 Japan: Graphene Market, by Application
9.1.1.5 South Korea: Graphene Market –Revenue and Forecast to 2028 (US$ Million)
9.1.1.5.1 South Korea: Graphene Market, by Type
9.1.1.5.2 South Korea: Graphene Market, by Application
9.1.1.6 Rest of Asia Pacific: Graphene Market –Revenue and Forecast to 2028 (US$ Million)
9.1.1.6.1 Rest of Asia Pacific: Graphene Market, by Type
9.1.1.6.2 Rest of Asia Pacific: Graphene Market, by Application
10. Company Profiles
10.1 XG SCIENCES
10.1.1 Key Facts
10.1.2 Business Description
10.1.3 Products and Services
10.1.4 Financial Overview
10.1.5 SWOT Analysis
10.1.6 Key Developments
10.2 THE SIXTH ELEMENT MATERIALS TECHNOLOGY CO., LTD
10.2.1 Key Facts
10.2.2 Business Description
10.2.3 Products and Services
10.2.4 Financial Overview
10.2.5 SWOT Analysis
10.2.6 Key Developments
10.3 GLOBAL GRAPHENE GROUP
10.3.1 Key Facts
10.3.2 Business Description
10.3.3 Products and Services
10.3.4 Financial Overview
10.3.5 SWOT Analysis
10.3.6 Key Developments
10.4 GRAPHENEA
10.4.1 Key Facts
10.4.2 Business Description
10.4.3 Products and Services
10.4.4 Financial Overview
10.4.5 SWOT Analysis
10.4.6 Key Developments
10.5 DIRECTA PLUS S.P.A
10.5.1 Key Facts
10.5.2 Business Description
10.5.3 Products and Services
10.5.4 Financial Overview
10.5.5 SWOT Analysis
10.5.6 Key Developments
10.6 AVANZARE INNOVACION TECNOLOGICA S.L.
10.6.1 Key Facts
10.6.2 Business Description
10.6.3 Products and Services
10.6.4 Financial Overview
10.6.5 SWOT Analysis
10.6.6 Key Developments
10.7 THOMAS SWAN AND CO. LTD.
10.7.1 Key Facts
10.7.2 Business Description
10.7.3 Products and Services
10.7.4 Financial Overview
10.7.5 SWOT Analysis
10.7.6 Key Developments
10.8 MORSH
10.8.1 Key Facts
10.8.2 Business Description
10.8.3 Products and Services
10.8.4 Financial Overview
10.8.5 SWOT Analysis
10.8.6 Key Developments
10.9 PERPETUUS ADVANCED MATERIALS PLC
10.9.1 Key Facts
10.9.2 Business Description
10.9.3 Products and Services
10.9.4 Financial Overview
10.9.5 SWOT Analysis
10.9.6 Key Developments
11. Appendix
11.1 About The Insight Partners
11.2 Glossary of Terms
LIST OF TABLES
Table 1. Percentage of Graphene Patents per Country
Table 2. List of Applicants for Graphene-Related Patents
Table 3. Asia Pacific Graphene Market –Revenue and Forecast to 2028 (US$ Million)
Table 4. Australia Graphene Market, by Type – Revenue and Forecast to 2028 (USD Million)
Table 5. Australia Graphene Market, by Application – Revenue and Forecast to 2028 (USD Million)
Table 6. China Graphene Market, by Type – Revenue and Forecast to 2028 (USD Million)
Table 7. China Graphene Market, by Application – Revenue and Forecast to 2028 (USD Million)
Table 8. India Graphene Market, by Type – Revenue and Forecast to 2028 (USD Million)
Table 9. India Graphene Market, by Application – Revenue and Forecast to 2028 (USD Million)
Table 10. Japan Graphene Market, by Type – Revenue and Forecast to 2028 (USD Million)
Table 11. Japan Graphene Market, by Application – Revenue and Forecast to 2028 (USD Million)
Table 12. South Korea Graphene Market, by Type – Revenue and Forecast to 2028 (USD Million)
Table 13. South Korea Graphene Market, by Application – Revenue and Forecast to 2028 (USD Million)
Table 14. Rest of Asia Pacific Graphene Market, by Type – Revenue and Forecast to 2028 (USD Million)
Table 15. Rest of Asia Pacific Graphene Market, by Application – Revenue and Forecast to 2028 (USD Million)
Table 16. Glossary of Terms, Asia Pacific Graphene Market
LIST OF FIGURES
Figure 1. Asia Pacific Graphene Market Segmentation
Figure 2. Asia Pacific Graphene Market Segmentation – By Country
Figure 3. Asia Pacific Graphene Market Overview
Figure 4. Asia Pacific Graphene Market, By Application
Figure 5. Asia Pacific Graphene Market, by Country
Figure 6. Asia Pacific Graphene Market, Industry Landscape
Figure 7. Porter's Five Forces Analysis
Figure 8. Ecosystem Chain: Graphene
Figure 9. Expert Opinion
Figure 10. Asia Pacific Graphene Market Impact Analysis of Drivers and Restraints
Figure 11. Asia Pacific Graphene Market – Revenue and Forecast to 2028 (US$ Million)
Figure 12. Asia Pacific Graphene Market Revenue Share, by Type (2020 and 2028)
Figure 13. Monolayer and Bilayer: Graphene Market – Revenue and Forecast to 2028 (US$ Million)
Figure 14. Graphene Nano-platelets : Graphene Market – Revenue and Forecast to 2028 (US$ Million)
Figure 15. Graphene Oxide : Graphene Market – Revenue and Forecast to 2028 (US$ Million)
Figure 16. Others: Graphene Market – Revenue and Forecast to 2028 (US$ Million)
Figure 17. Asia Pacific Graphene Market Revenue Share, by Application (2020 and 2028)
Figure 18. Composites : Graphene Market – Revenue and Forecast to 2028 (US$ Million)
Figure 19. Functional Inks, Paints and Coatings: Graphene Market – Revenue and Forecast to 2028 (US$ Million)
Figure 20. Energy Storage: Graphene Market – Revenue and Forecast to 2028 (US$ Million)
Figure 21. Electronics: Graphene Market – Revenue and Forecast to 2028 (US$ Million)
Figure 22. Polymer Additives: Graphene Market – Revenue and Forecast to 2028 (US$ Million)
Figure 23. RFID: Graphene Market – Revenue and Forecast to 2028 (US$ Million)
Figure 24. Others: Graphene Market – Revenue and Forecast to 2028 (US$ Million)
Figure 25. Geographic Overview of Asia Pacific Graphene Market
Figure 26. Asia Pacific: Graphene Market Revenue Share, by Key Country (2020 and 2028)
Figure 27. Australia: Graphene Market –Revenue and Forecast to 2028 (US$ Million)
Figure 28. China: Graphene Market –Revenue and Forecast to 2028 (US$ Million)
Figure 29. India: Graphene Market –Revenue and Forecast to 2028 (US$ Million)
Figure 30. Japan: Graphene Market –Revenue and Forecast to 2028 (US$ Million)
Figure 31. South Korea: Graphene Market –Revenue and Forecast to 2028 (US$ Million)
Figure 32. Rest of Asia Pacific: Graphene Market –Revenue and Forecast to 2028 (US$ Million)
- XG Sciences
- The Sixth Element Materials Technology Co., Ltd
- Global Graphene Group
- Graphenea, Inc.
- Directa Plus S.P.A
- AVANZARE INNOVACION TECNOLOGICA S.L.
- Thomas Swan & Co. Ltd.
- Morsh
- Perpetuus Advanced Materials PLC
- Save and reduce time carrying out entry-level research by identifying the growth, size, leading players and segments in the Asia Pacific graphene market.
- Highlights key business priorities in order to assist companies to realign their business strategies
- The key findings and recommendations highlight crucial progressive industry trends in the Asia Pacific graphene market, thereby allowing players across the value chain to develop effective long-term strategies
- Develop/modify business expansion plans by using substantial growth offering developed and emerging markets
- Scrutinize in-depth Asia Pacific market trends and outlook coupled with the factors driving the graphene market, as well as those hindering it
- Enhance the decision-making process by understanding the strategies that underpin commercial interest with respect to client products, segmentation, pricing, and distribution