Asia Pacific E-House Market Forecast to 2028 - COVID-19 Impact and Regional Analysis by Type (Fixed Substation and Mobile Substation), Component (Transformer, Bus Bar, Power Management System, Variable Frequency Drive, Switchgear, HVAC, and Others), and Application (Industrial and Utilities)
The E-house market in Asia Pacific is expected to grow from US$ 383.00 million in 2022 to US$ 591.08 million by 2028. It is estimated to grow at a CAGR of 7.5% from 2022 to 2028.
Surge in Demand for E-Houses from Oil & Gas Sector
Earlier, the market players in the oil & gas industry obtained their drives, switchgear, and automation systems from multiple electrical equipment suppliers and houses through fabricators. But the rising demand for reduced cost, risks, and delivery time steered the industry to move away from old practices and toward the E-house. Further, increased strategic initiatives, such as investments by the market players, are major factors driving the growth of the APAC E-house market in the oil & gas industry. Further, companies such as Worldoils offer Single-lift and Modular E-houses for onshore or offshore applications majorly for the oil & gas and petrochemical industries. They are designed to protect against extreme climatic weather conditions and hazardous areas (Zone 2) environment. The company also offers 'Integrated System Design' Services for E&I interfacing between all E-house equipment. Such product launches for the oil & gas industry are also anticipated to drive the demand for E-houses.
Market Overview
China, Japan, India, Australia, South Korea, and rest of Asia Pacific are the key contributors to the E-house market in the Asia Pacific. In April 2021, Australia's government announced an investment of US$ 70.02 million (AU$ 90 million) for the country's 81 telecommunications infrastructure projects under the Regional Connectivity Program (RCP). Additionally, the Chinese government launched an initiative, 'Made in China 2025,' to support the country's manufacturing sector; this initiative will encourage companies that are operating in the manufacturing industry to initiate more projects. Moreover, the Government of India is providing funds to improve the country's infrastructure under the 'Smart City Project.' Under this project, several infrastructure developments, such as metro rail lines and road construction, are under construction in the country. Further, the construction of such projects requires mobile substations for temporary electricity supply. Moreover, in January 2022, a new rail project was inaugurated in South Korea to connect the Donghae line between Jejin Station, Goseong, and Gangneung. The project is worth US$ 2.31 billion and is expected to be completed by 2027. Thus, the growing construction of such projects and government initiatives to develop infrastructure across Asia Pacific countries are expected to boost the Asia Pacific E-house market growth.
Asia Pacific E-House Market Revenue and Forecast to 2028 (US$ Million)
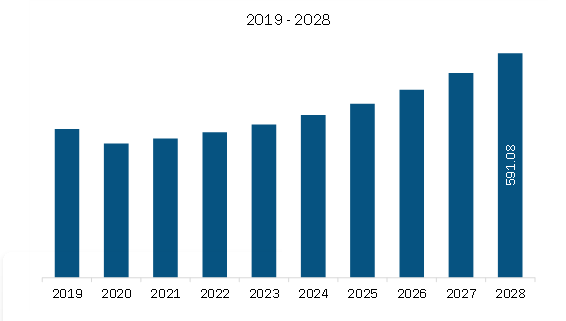
Get more information on this report :
Asia Pacific E-House Market Segmentation
The Asia Pacific E-house market is segmented into type, component, application, and country.
- Based on type, the market is bifurcated into fixed substation and mobile substation. The mobile substation segment registered the larger market share in 2022.
- Based on component, the market is segmented into transformer, bus bar, power management system, variable frequency drive, switchgear, HVAC, and others. The transformer segment held the largest market share in 2022.
- Based on application, the market is bifurcated into industrial and utilities. The industrial segment held the larger market share in 2022.
- Based on country, the market is segmented into China, Japan, India, Australia, South Korea, and rest of Asia Pacific. China dominated the market share in 2022.
ABB Ltd; Becker Mining Systems AG; Eaton; Powell Industries, Inc.; Powergear Limited; Schneider Electric SE; Sécheron; Siemens AG; and WEG are the leading companies operating in the E-house market in the Asia Pacific region.
1. Introduction
1.1 Study Scope
1.2 The Insight Partners Research Report Guidance
1.3 Market Segmentation
2. Key Takeaways
3. Research Methodology
3.1 Coverage
3.2 Secondary Research
3.3 Primary Research
4. APAC E-House Market Landscape
4.1 Market Overview
4.2 APAC PEST Analysis
4.3 Ecosystem Analysis
4.4 Expert Opinion
5. APAC E-House Market – Key Market Dynamics
5.1 Market Drivers
5.1.1 Ease of Installation, Cost-Effectiveness, and Flexibility of E-House
5.1.2 Surge in Demand for E-Houses from Oil & Gas Sector
5.2 Market Restraints
5.2.1 Lack of Technical Expertise, High Maintenance and Replacement Cost, and Impact of COVID -19 Pandemic
5.3 Future Trends
5.3.1 Technological Advancements in E-Houses
5.4 Impact Analysis of Drivers and Restraints
6. E-House Market – APAC Analysis
6.1 APAC E-House Market Overview
6.2 APAC E-House Market – Revenue and Forecast to 2028 (US$ Million)
7. APAC E-House Market Revenue and Forecast to 2028 – Type
7.1 Overview
7.2 APAC E-house Market, By Type (2021 And 2028)
7.3 Fixed Substation
7.3.1 Overview
7.3.2 Fixed Substation: E-house Market Revenue and Forecast To 2028 (US$ Million)
7.4 Mobile Substation
7.4.1 Overview
7.4.2 Mobile Substation: E-House Market Revenue and Forecast To 2028 (US$ Million)
8. APAC E-House Market Analysis – By Component
8.1 Overview
8.2 APAC E-House Market, By Component (2021 and 2028)
8.3 Transformer
8.3.1 Overview
8.3.2 Transformer: E-House Market – Revenue, and Forecast to 2028 (US$ Million)
8.4 Bus Bar
8.4.1 Overview
8.4.2 Bus Bar: E-House Market – Revenue, and Forecast to 2028 (US$ Million)
8.5 Power Management System
8.5.1 Overview
8.5.2 Power Management System: E-House Market – Revenue, and Forecast to 2028 (US$ Million)
8.6 Variable Frequency Drive
8.6.1 Overview
8.6.2 Variable Frequency Drive: E-House Market – Revenue, and Forecast to 2028 (US$ Million)
8.7 Switchgear
8.7.1 Overview
8.7.2 Switchgear: E-House Market – Revenue, and Forecast to 2028 (US$ Million)
8.8 HVAC
8.8.1 Overview
8.8.2 HVAC: E-House Market – Revenue, and Forecast to 2028 (US$ Million)
8.9 Others
8.9.1 Overview
8.9.2 Others: E-House Market – Revenue, and Forecast to 2028 (US$ Million)
9. APAC E-House Market Analysis – By Application
9.1 Overview
9.2 APAC E-House Market, By Application (2021 and 2028)
9.3 Industrial
9.3.1 Overview
9.3.2 Industrial: E-House Market – Revenue and Forecast to 2028 (US$ Million)
9.4 Utilities
9.4.1 Overview
9.4.2 Utilities: E-House Market – Revenue and Forecast to 2028 (US$ Million)
10. APAC E-House Market – Country Analysis
10.1 Overview
10.1.1 APAC: E-House Market- by Key Country
10.1.1.1 Australia: E-House Market – Revenue and Forecast to 2028 (US$ Million)
10.1.1.1.1 Australia: E-House Market- by Type
10.1.1.1.2 Australia: E-House Market- By Application
10.1.1.1.3 Australia: E-House Market- By Component
10.1.1.2 China: E-House Market – Revenue and Forecast to 2028 (US$ Million)
10.1.1.2.1 China: E-House Market- by Type
10.1.1.2.2 China: E-House Market- By Application
10.1.1.2.3 China: E-House Market- By Component
10.1.1.3 India: E-House Market – Revenue and Forecast to 2028 (US$ Million)
10.1.1.3.1 India: E-House Market- by Type
10.1.1.3.2 India: E-House Market- By Application
10.1.1.3.3 India: E-House Market- By Component
10.1.1.4 Japan: E-House Market – Revenue and Forecast to 2028 (US$ Million)
10.1.1.4.1 Japan: E-House Market- by Type
10.1.1.4.2 Japan: E-House Market- By Application
10.1.1.4.3 Japan: E-House Market- By Component
10.1.1.5 South Korea: E-House Market – Revenue and Forecast to 2028 (US$ Million)
10.1.1.5.1 South Korea: E-House Market- by Type
10.1.1.5.2 South Korea: E-House Market- By Application
10.1.1.5.3 South Korea: E-House Market- By Component
10.1.1.6 Rest of APAC: E-House Market – Revenue and Forecast to 2028 (US$ Million)
10.1.1.6.1 Rest of APAC: E-House Market- by Type
10.1.1.6.2 Rest of APAC: E-House Market- By Application
10.1.1.6.3 Rest of APAC: E-House Market- By Component
11. Industry Landscape
11.1 Overview
11.2 Merger and Acquisition
11.3 New Product Development
12. Company Profiles
12.1 ABB Ltd
12.1.1 Key Facts
12.1.2 Business Description
12.1.3 Products and Services
12.1.4 Financial Overview
12.1.5 SWOT Analysis
12.1.6 Key Developments
12.2 Eaton
12.2.1 Key Facts
12.2.2 Business Description
12.2.3 Products and Services
12.2.4 Financial Overview
12.2.5 SWOT Analysis
12.2.6 Key Developments
12.3 Becker Mining Systems AG
12.3.1 Key Facts
12.3.2 Business Description
12.3.3 Products and Services
12.3.4 Financial Overview
12.3.5 SWOT Analysis
12.3.6 Key Developments
12.4 Schneider Electric SE
12.4.1 Key Facts
12.4.2 Business Description
12.4.3 Products and Services
12.4.4 Financial Overview
12.4.5 SWOT Analysis
12.4.6 Key Developments
12.5 Siemens AG
12.5.1 Key Facts
12.5.2 Business Description
12.5.3 Products and Services
12.5.4 Financial Overview
12.5.5 SWOT Analysis
12.5.6 Key Developments
12.6 WEG
12.6.1 Key Facts
12.6.2 Business Description
12.6.3 Products and Services
12.6.4 Financial Overview
12.6.5 SWOT Analysis
12.6.6 Key Developments
12.7 Sécheron
12.7.1 Key Facts
12.7.2 Business Description
12.7.3 Products and Services
12.7.4 Financial Overview
12.7.5 SWOT Analysis
12.7.6 Key Developments
12.8 Powergear Limited
12.8.1 Key Facts
12.8.2 Business Description
12.8.3 Products and Services
12.8.4 Financial Overview
12.8.5 SWOT Analysis
12.8.6 Key Developments
12.9 Powell Industries, Inc.
12.9.1 Key Facts
12.9.2 Business Description
12.9.3 Products and Services
12.9.4 Financial Overview
12.9.5 SWOT Analysis
12.9.6 Key Developments
13. Appendix
13.1 About the Insight Partners
13.2 Word Index
LIST OF TABLES
Table 1. APAC E-House Market – Revenue and Forecast to 2028 (US$ Million)
Table 2. Australia: E-House Market- by Type –Revenue and Forecast to 2028 (US$ Million)
Table 3. Australia: E-House Market- By Application –Revenue and Forecast to 2028 (US$ Million)
Table 4. Australia: E-House Market- By Component –Revenue and Forecast to 2028 (US$ Million)
Table 5. China: E-House Market- by Type –Revenue and Forecast to 2028 (US$ Million)
Table 6. China: E-House Market- By Application –Revenue and Forecast to 2028 (US$ Million)
Table 7. China: E-House Market- By Component –Revenue and Forecast to 2028 (US$ Million)
Table 8. India: E-House Market- by Type –Revenue and Forecast to 2028 (US$ Million)
Table 9. India: E-House Market- By Application –Revenue and Forecast to 2028 (US$ Million)
Table 10. India: E-House Market- By Component –Revenue and Forecast to 2028 (US$ Million)
Table 11. Japan: E-House Market- by Type –Revenue and Forecast to 2028 (US$ Million)
Table 12. Japan: E-House Market- By Application –Revenue and Forecast to 2028 (US$ Million)
Table 13. Japan: E-House Market- By Component –Revenue and Forecast to 2028 (US$ Million)
Table 14. South Korea: E-House Market- by Type –Revenue and Forecast to 2028 (US$ Million)
Table 15. South Korea: E-House Market- By Application –Revenue and Forecast to 2028 (US$ Million)
Table 16. South Korea: E-House Market- By Component –Revenue and Forecast to 2028 (US$ Million)
Table 17. Rest of APAC: E-House Market- by Type –Revenue and Forecast to 2028 (US$ Million)
Table 18. Rest of APAC: E-House Market- By Application –Revenue and Forecast to 2028 (US$ Million)
Table 19. Rest of APAC: E-House Market- By Component –Revenue and Forecast to 2028 (US$ Million)
Table 20. List of Abbreviation
LIST OF FIGURES
Figure 1. APAC E-House Market Segmentation
Figure 2. APAC E-House Market Segmentation – By Country
Figure 3. APAC E-House Market Overview
Figure 4. APAC E-House Market, By Type
Figure 5. APAC E-House Market, By Application
Figure 6. APAC E-House Market, By Component
Figure 7. APAC E-House Market, By Country
Figure 8. Asia-Pacific: PEST Analysis
Figure 9. APAC Ecosystem Analysis
Figure 10. Expert Opinion
Figure 11. APAC E-House Market Impact Analysis of Drivers and Restraints
Figure 12. APAC E-House Market – Revenue and Forecast to 2028 (US$ Million)
Figure 13. APAC E-house Market, By Type (2021 and 2028)
Figure 14. APAC Fixed Substation: E-house Market Revenue and Forecast to 2028 (US$ Million)
Figure 15. APAC Mobile Substation: E-house Market Revenue and Forecast to 2028 (US$ Million)
Figure 16. APAC E-House market Revenue Share, by Component (2021 and 2028)
Figure 17. APAC Transformer: E-House Market – Revenue, and Forecast to 2028 (US$ Million)
Figure 18. APAC Bus Bar: E-House Market – Revenue, and Forecast to 2028 (US$ Million)
Figure 19. APAC Power Management System: E-House Market – Revenue, and Forecast to 2028 (US$ Million)
Figure 20. APAC Variable Frequency Drive: E-House Market – Revenue, and Forecast to 2028 (US$ Million)
Figure 21. APAC Switchgear: E-House Market – Revenue, and Forecast to 2028 (US$ Million)
Figure 22. APAC HVAC: E-House Market – Revenue, and Forecast to 2028 (US$ Million)
Figure 23. APAC Others: E-House Market – Revenue, and Forecast to 2028 (US$ Million)
Figure 24. APAC E-House Market Revenue Share, by Application (2021 and 2028)
Figure 25. APAC Industrial: E-House Market – Revenue and Forecast to 2028 (US$ Million)
Figure 26. APAC Utilities: E-House Market – Revenue and Forecast to 2028 (US$ Million)
Figure 27. APAC: E-House Market, By Key Country- Revenue (2021) (US$ Million)
Figure 28. APAC: E-House Market Revenue Share, By Key Country (2021 and 2028)
Figure 29. Australia: E-House Market – Revenue and Forecast to 2028 (US$ Million)
Figure 30. China: E-House Market – Revenue and Forecast to 2028 (US$ Million)
Figure 31. India: E-House Market – Revenue and Forecast to 2028 (US$ Million)
Figure 32. Japan: E-House Market – Revenue and Forecast to 2028 (US$ Million)
Figure 33. South Korea: E-House Market – Revenue and Forecast to 2028 (US$ Million)
Figure 34. Rest of APAC: E-House Market – Revenue and Forecast to 2028 (US$ Million)
- ABB Ltd
- Becker Mining Systems AG
- Eaton
- Powell Industries, Inc.
- Powergear Limited
- Schneider Electric SE
- Sécheron
- Siemens AG
- WEG
- Save and reduce time carrying out entry-level research by identifying the growth, size, leading players, and segments in the Asia Pacific E-house market.
- Highlights key business priorities in order to assist companies to realign their business strategies
- The key findings and recommendations highlight crucial progressive industry trends in the Asia Pacific E-house market, thereby allowing players across the value chain to develop effective long-term strategies
- Develop/modify business expansion plans by using substantial growth offering developed and emerging markets
- Scrutinize in-depth Asia Pacific market trends and outlook coupled with the factors driving the E-house market, as well as those hindering it
- Enhance the decision-making process by understanding the strategies that underpin commercial interest with respect to client products, segmentation, pricing, and distribution