Asia Pacific 3D Secure Authentication Market Forecast to 2028 - COVID-19 Impact and Regional Analysis By Component (Solution and Services) and End User (Banks and Merchant & Payment Processor)
Market Introduction
The countries analyzed include China, India, Japan, South Korea, and Australia. These countries have been showcasing tremendous growth in their e-commerce and banking sector. Technological advancements and adoption rate has soared up significantly in these countries. A substantial percentage of the population in the respective countries mentioned above has started the use of card-based payment to enhance the digitalization in the country. Owing to the need to enter card details online, the demand for better security while making online payment has ascended steeply. This, in turn, has led to the development and adoption of authentication technology, thereby boosting the growth of the 3D secure authentication market. The surge in digitalization in the banking sector in the APAC region has led to a rise in the availability of debit cards and credit cards. The easy obtainability of these cards has enabled a significant fraction of the population to use card details for online transactions, which has led to a rise in the adoption of online payments. In addition to growth in online payments, owing to availability of cards and ease of online payment portals, the presence of companies offering authentication technology also plays a significant role.
The COVID-19 pandemic has severely impacted APAC due to the wide spread of novel coronavirus. The region has highly populated countries, which leads to the greater risk of the spread. According to the Organization for Economic Co-operation and Development (OECD), the pandemic has affected major economies such as China, India, Australia, and Japan, which are experiencing inflation. India is the worst-hit country in this region due to the pandemic. In Asian economy, the e-commerce and m-commerce sales are increasing drastically in the wake of the COVID-19 pandemic. Countries such as Singapore, India, and China have observed a positive trend in the penetration of e-commerce channels. Owing to the rise in the e-commerce orders due to the increasing COVID-19 confirmed cases, the online payments have increased drastically, which eventually propelled the adoption of 3D authentication technology.
Get more information on this report :
Market Overview and Dynamics
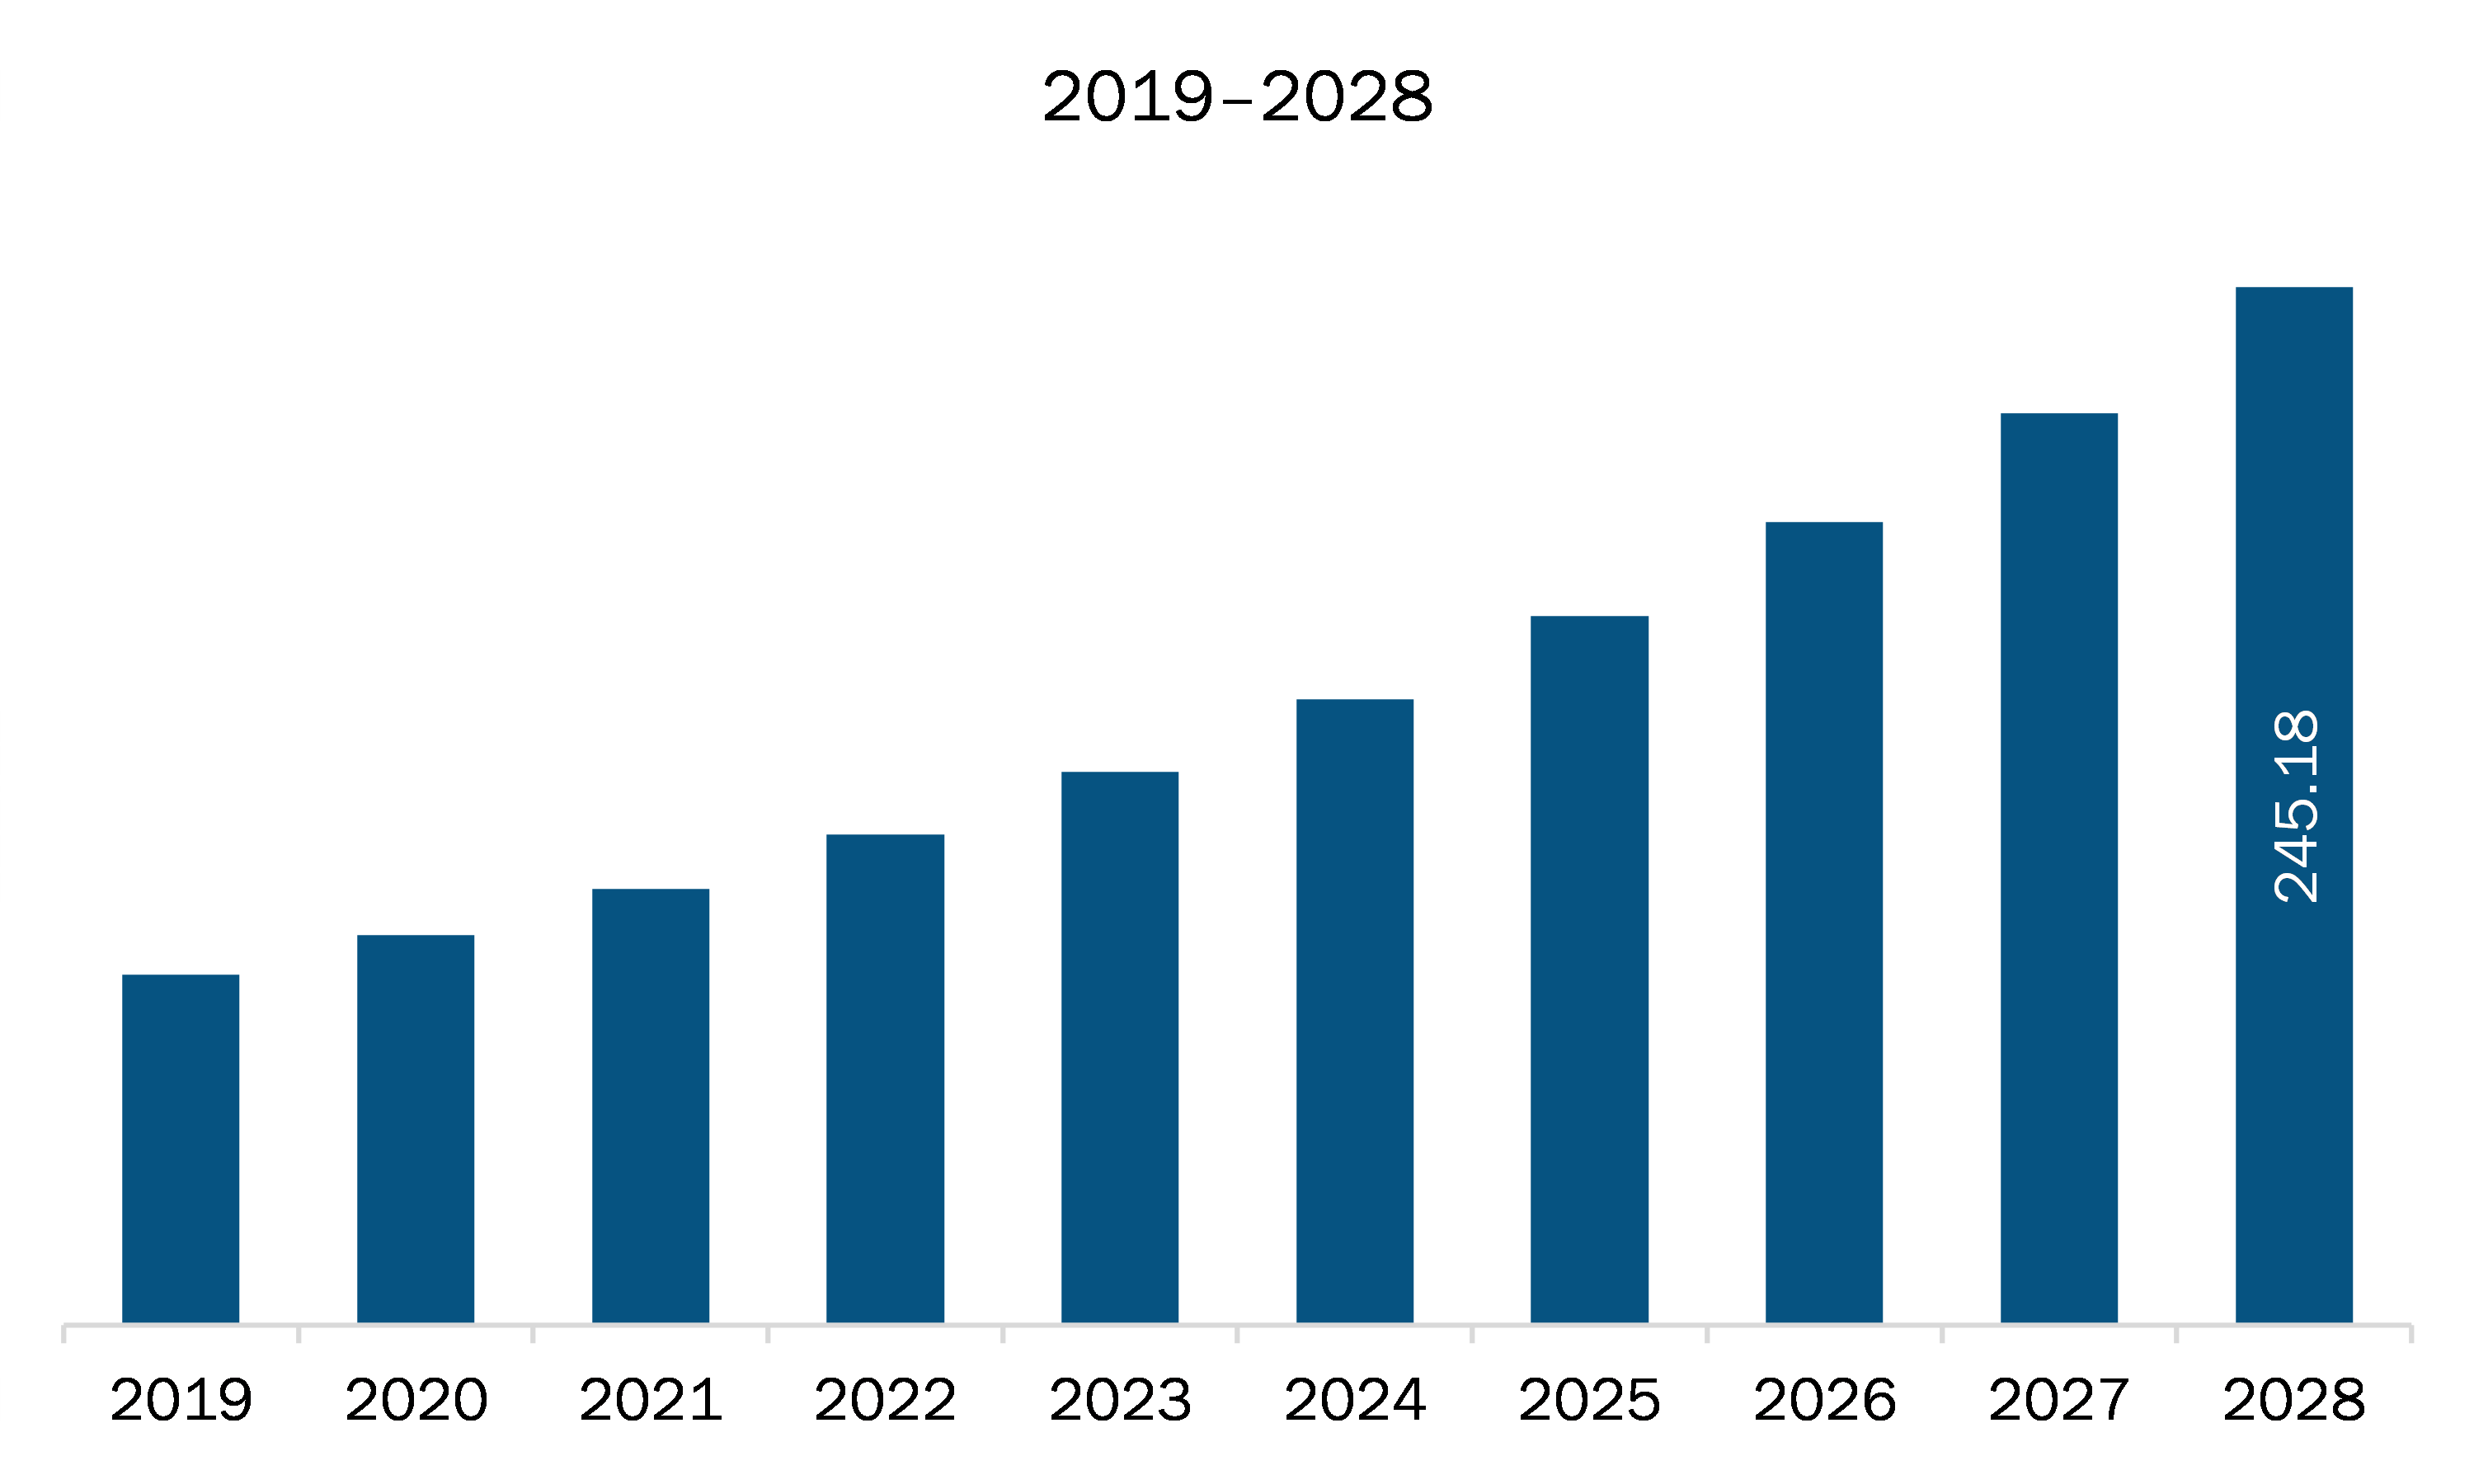
The 3D secure authentication market in APAC is expected to grow from US$ 103.06 million in 2021 to US$ 245.18 million by 2028; it is estimated to grow at a CAGR of 13.2% from 2021 to 2028. Due to the occurrence of pandemic, the e-commerce market in Asian countries has seen a growth. Moreover, owing to digitalization, majority of businesses are getting inclined toward online method and consumers into e-commerce channel. Therefore, companies such as Netcetera, are looking forward to make full utilization of 2.0 version in order to assist merchants, payment services providers, and acquirers in decreasing transaction abandonments while enhancing overall shopping experience. Presence of major companies and growth in online payment due to rising number of e-commerce orders are projected to drive the adoption of authentication technology, thereby boosting the market growth.
Key Market Segments
The APAC 3D secure authentication market is segmented into component and end user. Based on component, the 3D secure authentication is segmented into solution and services. The solution segment dominated the 3D secure authentication market growth in 2020. With growing online frauds while making online payments, the penetration of 3D secure authentication solution will rise. Based on end-user, the 3D secure authentication is segmented into banks, merchants & payment processor. As merchants banks are the prominent end user of 3D secure authentication technology, the merchant & payment processor dominated the market growth in 2020. Based on country, the APAC 3D secure authentication market is segmented into Australia, China, India, Japan, and South Korea.
Major Sources and Companies Listed
A few major primary and secondary sources referred to for preparing this report on the 3D secure authentication market in APAC are company websites, annual reports, financial reports, national government documents, and statistical database, among others. Major companies listed in the report are AsiaPay Limited; GPayments Pvt. Ltd.; iZealiant Technologies Pvt. Ltd.; Modirum; Netcetera; Ravelin Technology Ltd; RS Software; and UL, LLC.
Reasons to buy report
- To understand the APAC 3D secure authentication market landscape and identify market segments that are most likely to guarantee a strong return.
- Stay ahead of the race by comprehending the ever-changing competitive landscape for APAC 3D secure authentication market.
- Efficiently plan M&A and partnership deals in APAC 3D secure authentication market by identifying market segments with the most promising probable sales.
- Helps to take knowledgeable business decisions from perceptive and comprehensive analysis of market performance of various segment form APAC 3D secure authentication market.
- Obtain market revenue forecast for market by various segments from 2021-2028 in APAC region.
APAC 3D Secure Authentication Market Segmentation
APAC 3D Secure Authentication Market - By Component
- Solution
- Services
APAC 3D Secure Authentication Market - By End User
- Banks
- Merchants & Payment Processor
APAC 3D Secure Authentication Market - By Country
- Australia
- China
- India
- Japan
- South Korea
- Rest of APAC
APAC 3D Secure Authentication Market - Company Profiles
- AsiaPay Limited
- GPayments Pvt. Ltd.
- iZealiant Technologies Pvt. Ltd.
- Modirum
- Netcetera
- Ravelin Technology Ltd
- RS Software
- UL, LLC
1. Introduction
1.1 Study Scope
1.2 The Insight Partners Research Report Guidance
1.3 Market Segmentation
2. Key Takeaways
3. Research Methodology
3.1 Coverage
3.2 Secondary Research
3.3 Primary Research
4. APAC 3D Secure Authentication Market Landscape
4.1 Market Overview
4.2 APAC PEST Analysis
4.3 Ecosystem Analysis
4.4 Expert Opinion
5. APAC 3D Secure Authentication Market – Key Market Dynamics
5.1 Key Market Drivers
5.1.1 E-Commerce Platforms on Rise
5.1.1 Payment-Related Online Fraud is on Rise
5.2 Key Market Restraints
5.2.1 Data Breach Problems
5.3 Key Market Opportunities
5.3.1 Huge Growth in Asian Market
5.4 Future Trends
5.4.1 Updated Version 3D Secure Authentication Technology to Appear
5.5 Impact Analysis of Drivers and Restraints
6. 3D Secure Authentication Market – APAC Analysis
6.1 APAC 3D Secure Authentication Market Overview
6.2 APAC 3D Secure Authentication Market –Revenue and Forecast to 2028 (US$ Million)
7. APAC 3D Secure Authentication Market Analysis – By Component
7.1 Overview
7.2 APAC 3D Secure Authentication Market, By Component (2020 and 2028)
7.3 Solution
7.3.1 Overview
7.3.2 Solution: 3D Secure Authentication Market – Revenue and Forecast to 2028 (US$ Million)
7.4 Services
7.4.1 Overview
7.4.2 Services: 3D Secure Authentication Market – Revenue and Forecast to 2028 (US$ Million)
8. APAC 3D Secure Authentication Market – By End-User
8.1 Overview
8.2 APAC 3D Secure Authentication Market, by End-User (2020 and 2028)
8.3 Banks
8.3.1 Overview
8.3.2 Banks: 3D Secure Authentication Market – Revenue and Forecast to 2028 (US$ Million)
8.4 Merchant and Payment Processor
8.4.1 Overview
8.4.2 Merchant and Payment Processor: 3D Secure Authentication Market – Revenue and Forecast to 2028 (US$ Million)
9. APAC 3D Secure Authentication Market – Country Analysis
9.1 Overview
9.1.1 APAC: 3D Secure Authentication Market- by Key Country
9.1.1.1 Australia: 3D Secure Authentication Market – Revenue and Forecast to 2028 (US$ Million)
9.1.1.1.1 Australia: 3D Secure Authentication Market- by Component
9.1.1.1.2 Australia: 3D Secure Authentication Market- By End-User
9.1.1.2 China: 3D Secure Authentication Market – Revenue and Forecast to 2028 (US$ Million)
9.1.1.2.1 China: 3D Secure Authentication Market- by Component
9.1.1.2.2 China: 3D Secure Authentication Market- By End-User
9.1.1.3 India: 3D Secure Authentication Market – Revenue and Forecast to 2028 (US$ Million)
9.1.1.3.1 India: 3D Secure Authentication Market- by Component
9.1.1.3.2 India: 3D Secure Authentication Market- By End-User
9.1.1.4 Japan: 3D Secure Authentication Market – Revenue and Forecast to 2028 (US$ Million)
9.1.1.4.1 Japan: 3D Secure Authentication Market- by Component
9.1.1.4.2 Japan: 3D Secure Authentication Market- By End-User
9.1.1.5 South Korea: 3D Secure Authentication Market – Revenue and Forecast to 2028 (US$ Million)
9.1.1.5.1 South Korea: 3D Secure Authentication Market- by Component
9.1.1.5.2 South Korea: 3D Secure Authentication Market- By End-User
9.1.1.6 Rest of APAC: 3D Secure Authentication Market – Revenue and Forecast to 2028 (US$ Million)
9.1.1.6.1 Rest of APAC: 3D Secure Authentication Market- by Component
9.1.1.6.2 Rest of APAC: 3D Secure Authentication Market- By End-User
10. APAC 3D Secure Authentication Market- COVID-19 Impact Analysis
10.1 APAC
11. Industry Landscape
11.1 Overview
11.2 Market Initiative
11.3 New Development
12. Company Profiles
12.1 Netcetera
12.1.1 Key Facts
12.1.2 Business Description
12.1.3 Products and Services
12.1.4 Financial Overview
12.1.5 SWOT Analysis
12.1.6 Key Developments
12.2 GPayments Pvt. Ltd.
12.2.1 Key Facts
12.2.2 Business Description
12.2.3 Products and Services
12.2.4 Financial Overview
12.2.5 SWOT Analysis
12.2.6 Key Developments
12.3 AsiaPay Limited
12.3.1 Key Facts
12.3.2 Business Description
12.3.3 Products and Services
12.3.4 Financial Overview
12.3.5 SWOT Analysis
12.3.6 Key Developments
12.4 Modirum
12.4.1 Key Facts
12.4.2 Business Description
12.4.3 Products and Services
12.4.4 Financial Overview
12.4.5 SWOT Analysis
12.4.6 Key Developments
12.5 Ravelin Technology Ltd.
12.5.1 Key Facts
12.5.2 Business Description
12.5.3 Products and Services
12.5.4 Financial Overview
12.5.5 SWOT Analysis
12.5.6 Key Developments
12.6 RS Software
12.6.1 Key Facts
12.6.2 Business Description
12.6.3 Products and Services
12.6.4 Financial Overview
12.6.5 SWOT Analysis
12.6.6 Key Developments
12.7 UL, LLC
12.7.1 Key Facts
12.7.2 Business Description
12.7.3 Products and Services
12.7.4 Financial Overview
12.7.5 SWOT Analysis
12.7.6 Key Developments
12.8 iZealiant Technologies Pvt. Ltd.
12.8.1 Key Facts
12.8.2 Business Description
12.8.3 Products and Services
12.8.4 Financial Overview
12.8.5 SWOT Analysis
12.8.6 Key Developments
13. Appendix
13.1 About The Insight Partners
13.2 Word Index
LIST OF TABLES
Table 1. APAC 3D Secure Authentication Market – Revenue, and Forecast to 2028 (US$ Million)
Table 2. Australia: 3D Secure Authentication Market- by Component –Revenue and Forecast to 2028 (US$ Million)
Table 3. Australia: 3D Secure Authentication Market- By End-User –Revenue and Forecast to 2028 (US$ Million)
Table 4. China: 3D Secure Authentication Market- by Component –Revenue and Forecast to 2028 (US$ Million)
Table 5. China: 3D Secure Authentication Market- By End-User –Revenue and Forecast to 2028 (US$ Million)
Table 6. India: 3D Secure Authentication Market- by Component –Revenue and Forecast to 2028 (US$ Million)
Table 7. India: 3D Secure Authentication Market- By End-User –Revenue and Forecast to 2028 (US$ Million)
Table 8. Japan: 3D Secure Authentication Market- by Component –Revenue and Forecast to 2028 (US$ Million)
Table 9. Japan: 3D Secure Authentication Market- By End-User –Revenue and Forecast to 2028 (US$ Million)
Table 10. South Korea: 3D Secure Authentication Market- by Component –Revenue and Forecast to 2028 (US$ Million)
Table 11. South Korea: 3D Secure Authentication Market- By End-User –Revenue and Forecast to 2028 (US$ Million)
Table 12. Rest of APAC: 3D Secure Authentication Market- by Component –Revenue and Forecast to 2028 (US$ Million)
Table 13. Rest of APAC: 3D Secure Authentication Market- By End-User –Revenue and Forecast to 2028 (US$ Million)
Table 14. List of Abbreviation
LIST OF FIGURES
Figure 1. APAC 3D Secure Authentication Market Segmentation
Figure 2. APAC 3D Secure Authentication Market Segmentation – By Country
Figure 3. APAC 3D Secure Authentication Market Overview
Figure 4. Solution Segment Held the Largest Market Share
Figure 5. Merchant and Payment Processing Segment Held the Largest Market Share
Figure 6. China Held the Largest Market Share
Figure 7. APAC– PEST Analysis
Figure 8. Expert Opinion
Figure 9. APAC 3D Secure Authentication Market: Impact Analysis of Drivers and Restraints
Figure 10. APAC 3D Secure Authentication Market – Revenue and Forecast to 2028 (US$ Million)
Figure 11. APAC 3D Secure Authentication Market Revenue Share, by Component (2020 and 2028)
Figure 12. APAC Solution: 3D Secure Authentication Market – Revenue and Forecast to 2028 (US$ Million)
Figure 13. APAC Services 3D Secure Authentication Market – Revenue and Forecast to 2028 (US$ Million)
Figure 14. APAC 3D Secure Authentication Market Revenue Share, by End-User (2020 and 2028)
Figure 15. APAC Banks: 3D Secure Authentication Market – Revenue and Forecast to 2028 (US$ Million)
Figure 16. APAC Merchant and Payment Processor: 3D Secure Authentication Market – Revenue and Forecast to 2028 (US$ Million)
Figure 17. APAC: 3D Secure Authentication Market, BY Key Country– Revenue (2020) (US$ Million)
Figure 18. APAC: 3D Secure Authentication Market Revenue Share, By Key Country (2020 and 2028)
Figure 19. Australia: 3D Secure Authentication Market – Revenue and Forecast to 2028 (US$ Million)
Figure 20. China: 3D Secure Authentication Market – Revenue and Forecast to 2028 (US$ Million)
Figure 21. India: 3D Secure Authentication Market – Revenue and Forecast to 2028 (US$ Million)
Figure 22. Japan: 3D Secure Authentication Market – Revenue and Forecast to 2028 (US$ Million)
Figure 23. South Korea: 3D Secure Authentication Market – Revenue and Forecast to 2028 (US$ Million)
Figure 24. Rest of APAC: 3D Secure Authentication Market – Revenue and Forecast to 2028 (US$ Million)
Figure 25. Impact of COVID-19 Pandemic in APAC Country Markets
- AsiaPay Limited
- GPayments Pvt. Ltd.
- iZealiant Technologies Pvt. Ltd.
- Modirum
- Netcetera
- Ravelin Technology Ltd
- RS Software
- UL, LLC
- Save and reduce time carrying out entry-level research by identifying the growth, size, leading players and segments in the APAC 3D secure authentication market
- Highlights key business priorities in order to assist companies to realign their business strategies
- The key findings and recommendations highlight crucial progressive industry trends in the APAC 3D secure authentication market, thereby allowing players across the value chain to develop effective long-term strategies
- Develop/modify business expansion plans by using substantial growth offering developed and emerging markets
- Scrutinize in-depth APAC market trends and outlook coupled with the factors driving the 3D secure authentication market, as well as those hindering it
- Enhance the decision-making process by understanding the strategies that underpin commercial interest with respect to client products, segmentation, pricing and distribution